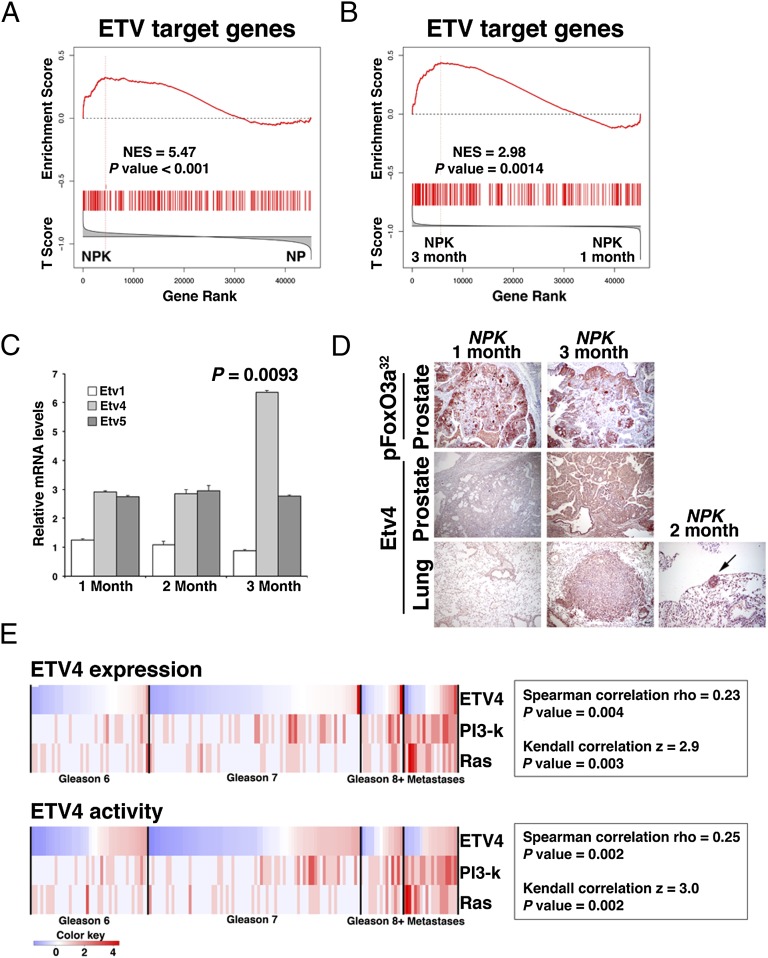
Fig. 7.
Activation of Etv4 by PI3-kinase and Ras signaling in metastatic prostate cancer. (A and B) GSEA analyses showing enrichment of human ETV target genes in reference signatures comparing NPK and NP mouse prostate tumors (A) or 3-mo vs. 1-mo NPK mouse prostate tumors (B). The mouse genes were mapped to their human orthologs for comparison with a reference signature of human ETV target genes. (C) Real-time quantitative PCR analyses of NPK prostate tumors at 1, 2, or 3 mo following tamoxifen induction showing the relative mRNA expression levels for Etv1, Etv4, and Etv5. P value compares the relative levels of Etv4 at 1 mo vs. 3 mo; other comparisons were not significant. (D) Immunostaining of NPK prostate tumors or lungs at 1, 2, or 3 mo following tamoxifen induction. Note that the tumor marker pFoxO3a32 (Fig. 2) is robustly expressed in the prostate tumors at both time points, whereas Etv4 is only expressed in the 3-mo prostate as well as in the lung metastases from this time point as well as the micrometastases at 2 mo. (Scale bars, 100 μm.) (E) Correlation of human ETV4 expression and activation of target genes with activation of both PI3-kinase and Ras signaling in human prostate cancer from the Taylor et al. (6) dataset. Shown is a heat map in which the status of ETV4 expression/activity as well as PI3-kinase and Ras signaling activation was evaluated in each of the clinical sample (i.e., primary tumors of the indicated Gleason scores and metastases; Materials and Methods). Correlation coefficients, and the P values of the correlations, are shown for both Spearman rho and Kendall z calculations. The color key indicates relative expression and activity levels of the ETV4 as well as PI3K and Ras pathways. Additional supporting data are provided in SI Appendix, Figs. S5 and S6 and Datasets S4 and S5.

