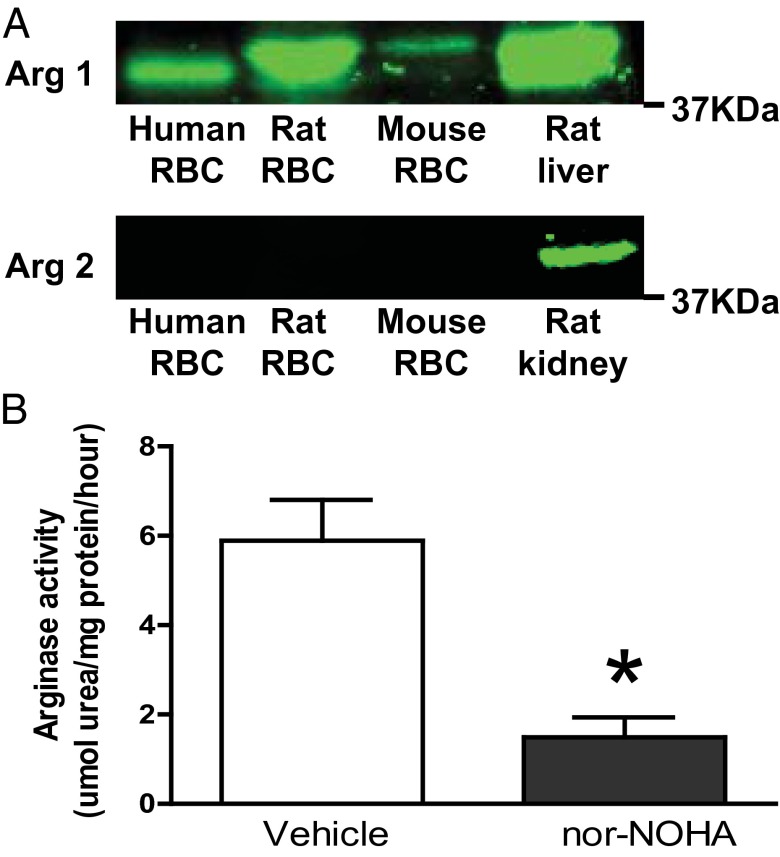
Fig. 1.
Arginase expression and activity in RBCs. (A) Western blot of arginase 1 expression in human, rat, and mouse RBCs and rat liver (positive control) and arginase 2 expression in RBCs and rat kidney (positive control). (B) Arginase activity in rat RBCs (n = 3) following incubation with vehicle or the arginase inhibitor nor-NOHA. Data are shown as mean ± SEM. Significant differences between treatments are shown; *P < 0.05 (t test).

