
Fig. 2.
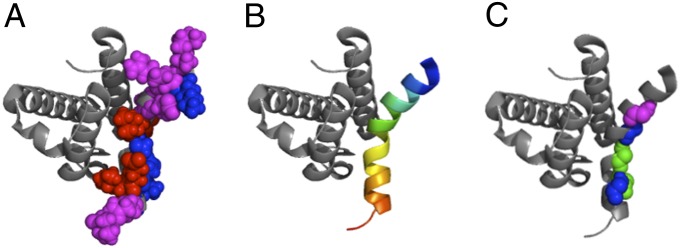
Φ-value analysis on the binding between pwtKIX and c-Myb*. Measured Φ-values are mapped on the 3D structure of the complex, pdb 1SB0 (14). Following Fersht and Sato (21), weak, 0 < Φ < 0.3 are represented in red; medium, 0.3 < Φ < 0.7 are represented in magenta; high, 0.7 < Φ < 1 are represented in blue. Φ-values > 1, reporting misfolding events (22, 23), are indicated in green. A and C refer to tertiary and secondary Φ-values, respectively (as defined in Table 1), whereas in B the structure of bound c-Myb is highlighted in rainbow coloring.