
Figure 2.
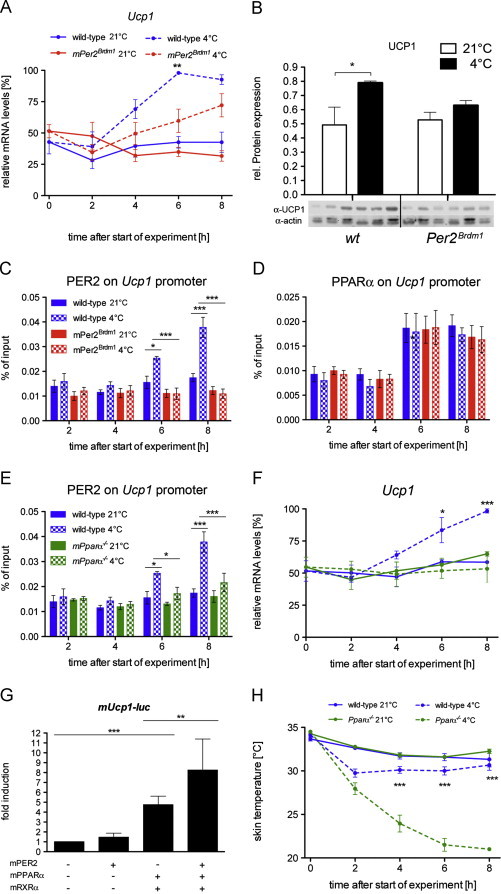
Cold-induction of Ucp1 gene and protein is reduced in the BAT of Per2Brdm1 mice: (A) quantitative real-time PCR analysis of Ucp1 in BAT of wild-type and Per2Brdm1 mice at 21 °C and 4 °C (n=6). Values are means±SEM and two-way ANOVA shows that genotypic difference at 4 °C is considered very significant (p<0.01). (B) Western blot analysis of BAT 8 h after start of the experiment. Values were normalized to actin. At 4 °C UCP1 is significantly induced (n=3, p<0.05). (C) Binding of PER2 to the Ucp1 promoter in BAT as revealed by ChIP. Plotted are mean values±SEM from three experiments. In wild-type mice, the binding of PER2 to the Ucp1 promoter is significantly increased at time points 6 h (p<0.05) and 8 h (p<0.001) as shown by two-way ANOVA. (D) Binding of PPARα to the Ucp1 promoter in BAT as revealed by ChIP. Plotted are mean values±SEM from three experiments. (E) Binding of PER2 to the Ucp1 promoter in BAT as revealed by ChIP. Plotted are mean values±SEM from three experiments. In wild-type mice, the binding of PER2 to the Ucp1 promoter is significantly increased at time points 6 h (p<0.05) and 8 h (p<0.001) as shown by two-way ANOVA. (F) Expression of Ucp1 in BAT of wild-type and PPARα−/− mice at 21 °C and 4 °C (n=3). Values are means±SEM and two-way ANOVA shows that genotypic difference at 4 °C is considered very significant (p<0.01). (G) Transcriptional regulation of the Ucp1 gene by PER2, PPARα and RXRα in HEK293 cells. Each value represents the mean±SD of six independent experiments. One-way ANOVA shows significant Ucp1 inductions by PPARα/RXRα (p<0.001) and by PPARα/RXRα/PER2 (p<0.01). (H) Wild-type and PPARα−-/-− mice were exposed to 4 °C (n=12 each genotype) or left at 21 °C (n=12 each genotype) and skin temperature was measured every 2 h over 8 h. Values are means±SEM and two-way ANOVA shows a significant effect on genotype at time points 4, 6 and 8 at 4 °C (p<0.001).