
Figure 3.
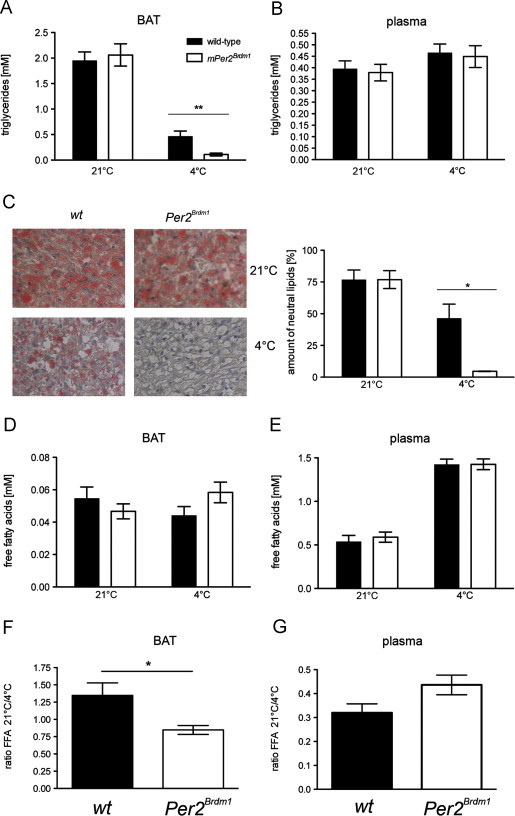
Triglycerides and free fatty acids in BAT and plasma of wild-type and Per2Brdm1 mice: (A) triglycerides in BAT at time points 6 and 8 h (n=11–12). Values are means±SEM and Student’s t-test reveals a genotypic difference at 4 °C (p<0.01). (B) Triglycerides in plasma at time points 6 and 8 h (n=8–12). Values are means±SEM. (C) Oil-red-O staining of BAT at time point 8 h. Plotted are the mean values±SEM from three independent experiments. One-way ANOVA reveals a genotypic significant difference at 4 °C (p<0.05). (D) Free fatty acids in BAT at time points 6 and 8 h (n=10–12). Values are means±SEM. (E) Free fatty acids in plasma at time points 6 and 8 h (n=10–12). Values are means±SEM. (F) Ratio of free fatty acids (FFA) at 21 °C/4 °C in BAT with data from (D), t-test p<0.05. (G) Ratio of free fatty acids (FFA) at 21 °C/4 °C in plasma with data from (E), t-test p>0.05.