
Figure S2.
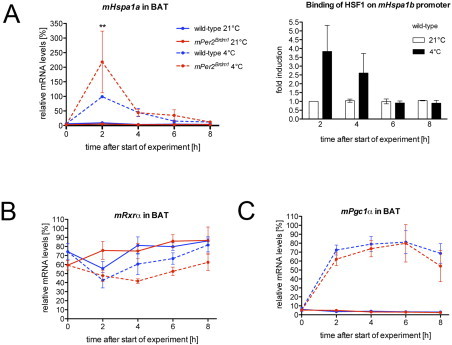
Gene expression analysis in response to cold exposure: (A) Left figure: quantitative real-time PCR analysis of Hspa1a in BAT of wild-type and Per2Brdm1 mice at 21 °C and 4 °C (n=6). Values are means±SEM. Right figure: binding of HSF1 to the Hspa1b promoter in wild-type BAT as revealed by ChIP. Plotted are mean values±SEM from two independent experiments. (B, C) Quantitative real-time PCR analysis of Rxrα and Pgc1α in BAT of wild-type and Per2Brdm1 mice at 21 °C and 4 °C (n=6). Values are means±SEM.