
Figure 1.
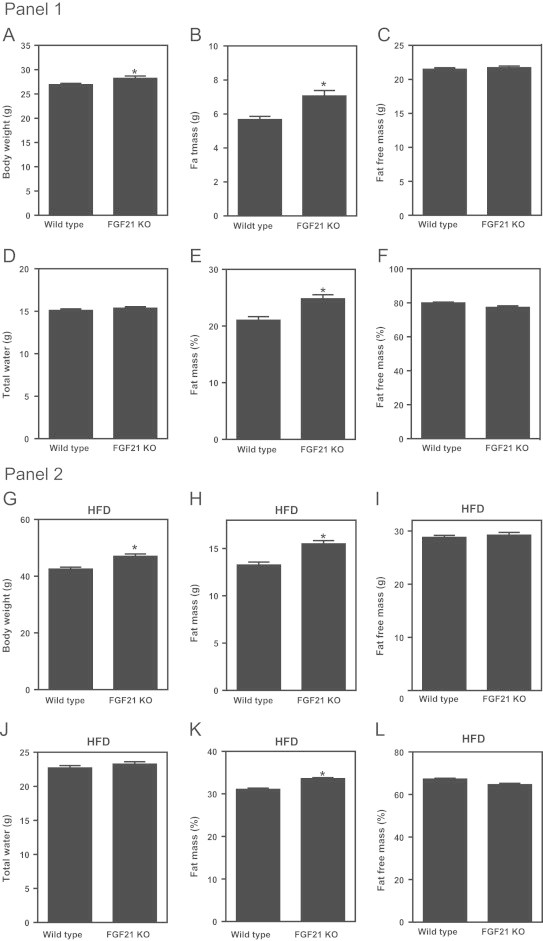
FGF21 null mice display mild obesity which is exacerbated by a high fat diet. Panel 1. Body weight was determined in a large cohort of chow fed, age matched male WT (n=30) and FGF21KO mice (n=24) (A). In the same cohort we also assessed body composition via qNMR and determined absolute fat mass (B), fat free mass (C) and water mass (D). The measures of both fat mass (E) and fat free mass (F) were then also expressed as a percentage of total body mass. Statistical significance is denoted by *. Differences were considered significant when P≤0.05.Panel 2. At 10 weeks of age WT and FGF21KO mice were fed a HFD for a period of 12 weeks. Following diet exposure we determined body weight (G), absolute fat mass (H), fat free mass (I) and water mass (J). The measures of both fat mass (K) and fat free mass (L) were then also expressed as percentage of total body mass. Statistical significance is denoted by *. Differences were considered significant when P≤0.05.