
Figure 5.
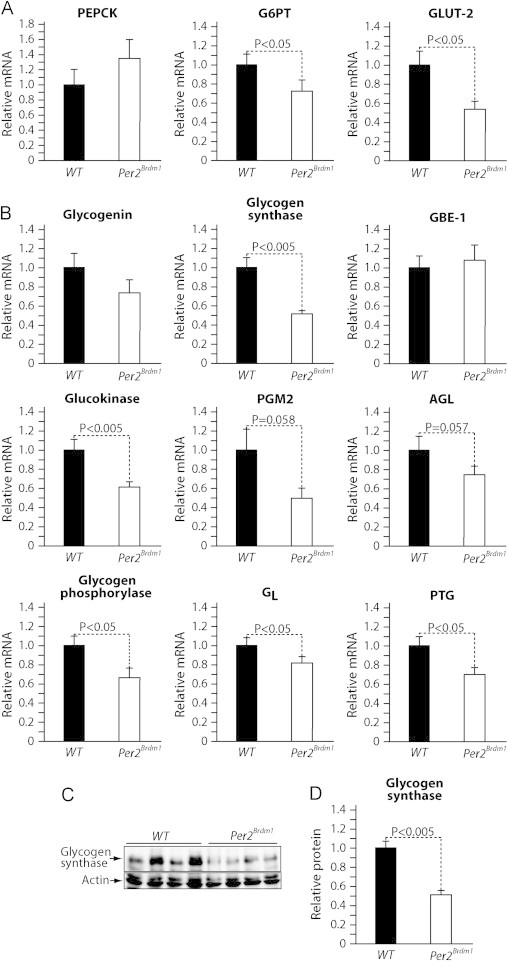
PER2 sustains glycogen synthase expression during refeeding. (A) Real-time qPCR analysis of the expression of key glucose output genes in livers from WT and Per2Brdm1 mice collected after 6 h of refeeding (TP2). (B) qPCR analysis of the expression of genes in glycogen metabolism from the livers above. (C) Representative immunoblot analysis of glycogen synthase protein levels from livers described above. (D) Quantification of the immunoblots in C. Data are expressed as means; standard errors are indicated. P values were calculated using the Student t-test.