
Figure 5.
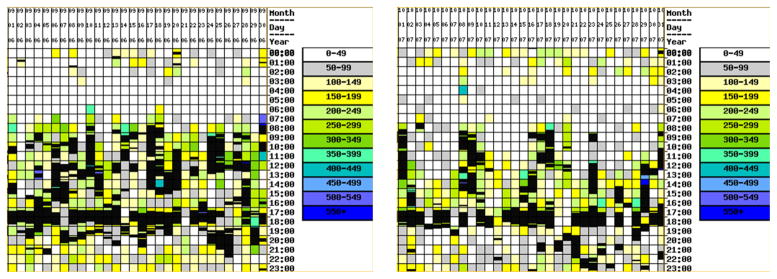
Monthly activity density maps generated using motion sensors for a resident showing a decline in mental health status over time. The vertical axis depicts time of day and the horizontal axis depicts day of the month. Colorful areas depict time and movement in apartment. Black areas depict time out of the apartment.