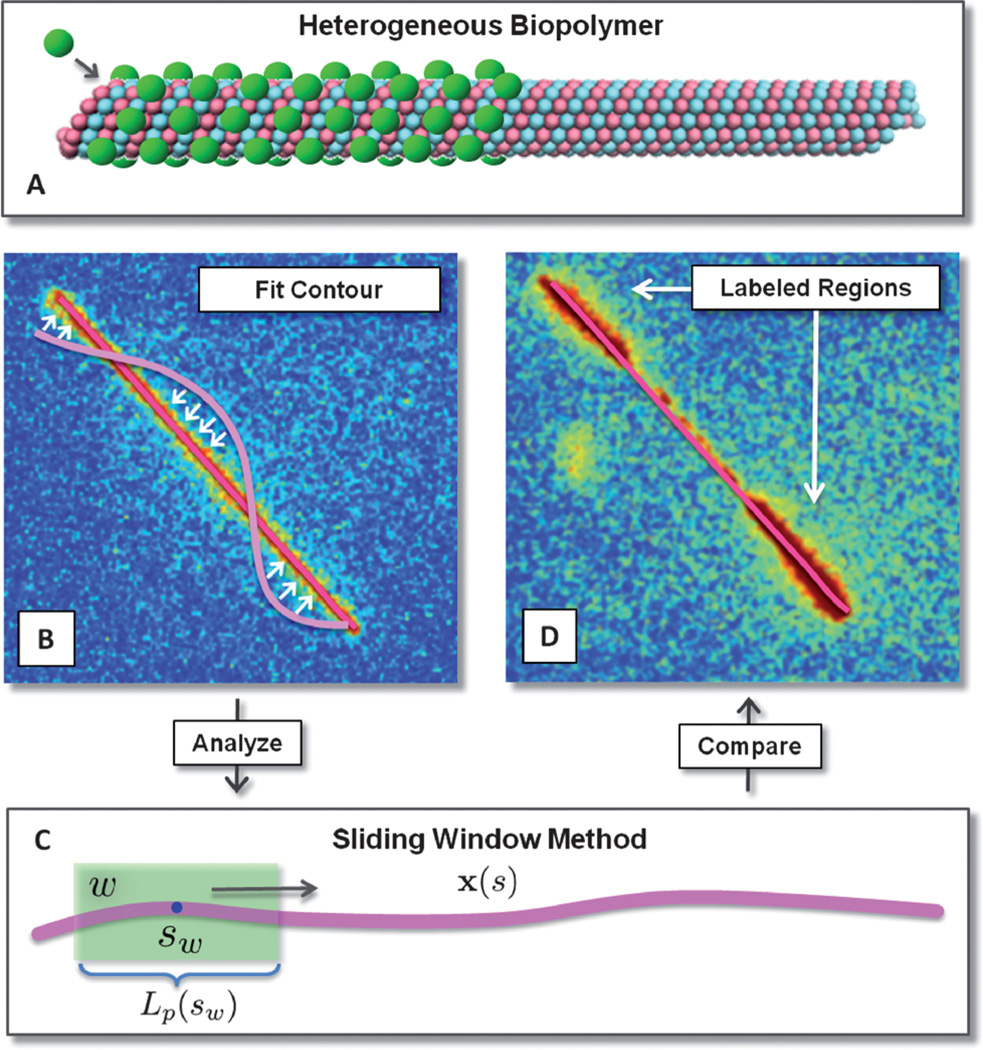
Fig. 1.
Schematic of heterogeneous biopolymer analysis. Fluorescence imaging, contour fitting, and processing. (A) Biopolymers can exhibit heterogeneous material properties for many reasons including binding of regulatory proteins, defects in polymer microstructure, or differences in stabilization agents. (B) Contours are represented by a continuous curve expanded in a Chebyshev polynomial basis and fit to the images by maximizing the overlap with fluorescence via the utility function in eqn (4) and steepest descent. (C) Heterogeneous elastic stiffness coefficients are determined locally using a window over which the spectrum of fluctuations is estimated and a stiffness attributed. (D) The heterogeneous stiffness locally attributed to the biopolymer is then compared with heterogeneous regions that were specifically labeled with a distinguishable fluorophore.

