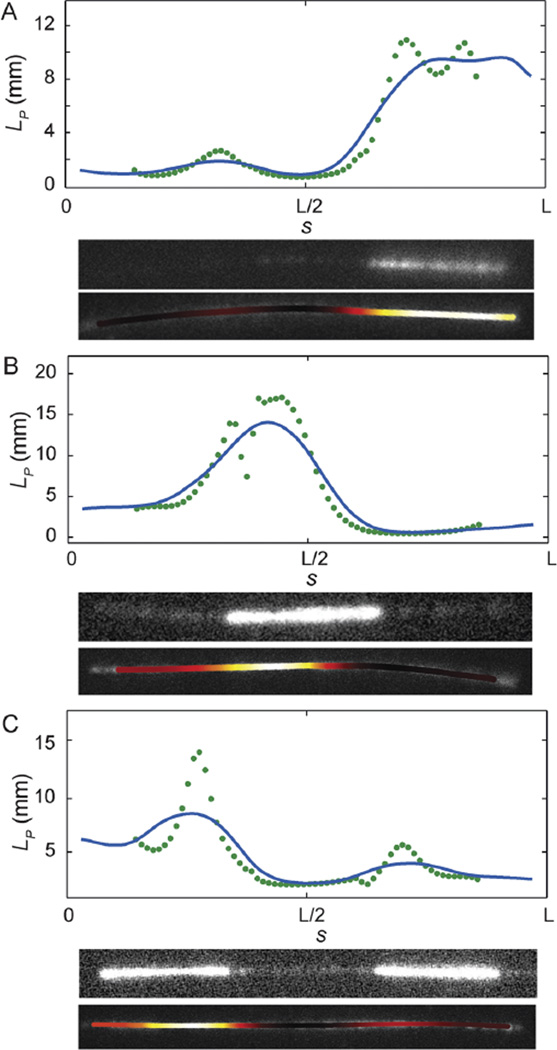
Fig. 4.
Experimental results. Shown are the results of the sliding window method for experimental ensembles of images of three fluctuating microtubules. The heterogeneous stiffness measured locally for the biopolymer correlates strongly with the biopolymer composition, as indicated by the fluorescence imaging of the GMPCPP-rich block. In each panel, we plot persistence length as a function of arc length. We also display the image of the filament obtained using the HiLyte tubulin signal, which was introduced with the GMPCPP tubulin, and an intensity map in which the stiffest regions of the polymer are colored white, which then transitions to yellow, orange, deep red, and black as filament stiffness decreases. In each case, we find very good correlation between the GMPCPP-rich blocks and regions of increased stiffness. The data points are from the sliding window method with window width L/4 and the blue curve gives the effective local persistence length L̄p(s) (see eqn (10)).

