
Figure 2.
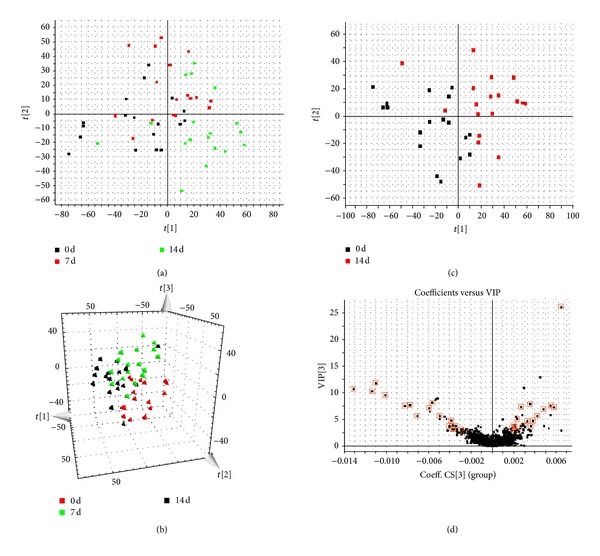
PCA model results for control and model group in positive mode (a). Trajectory analysis of PCA score plots (3D) for the serum samples in positive mode (b). PCA model results for 0 day and 14 days in positive mode (c). VIP plot of OPLS-DA of samples in positive mode (d).