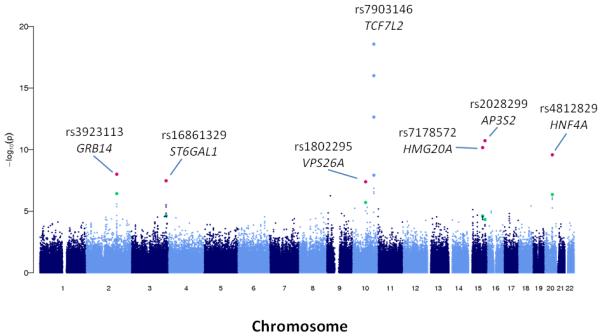
Figure 2.

Manhattan plot for the primary South Asian genome-wide association analysis. of men and women, using directly genotyped SNPs. At the six novel loci reaching genome wide-significance, the sentinel SNPs are indicated: green dot for GWA result, and red dot for combined analysis of GWA and replication data in South Asians.
