
Figure 1. Representative impedance profiles from one subject in Group 1 (MN + diclofenac + NTX) and one subject in Group 2 (MN + placebo + NTX).
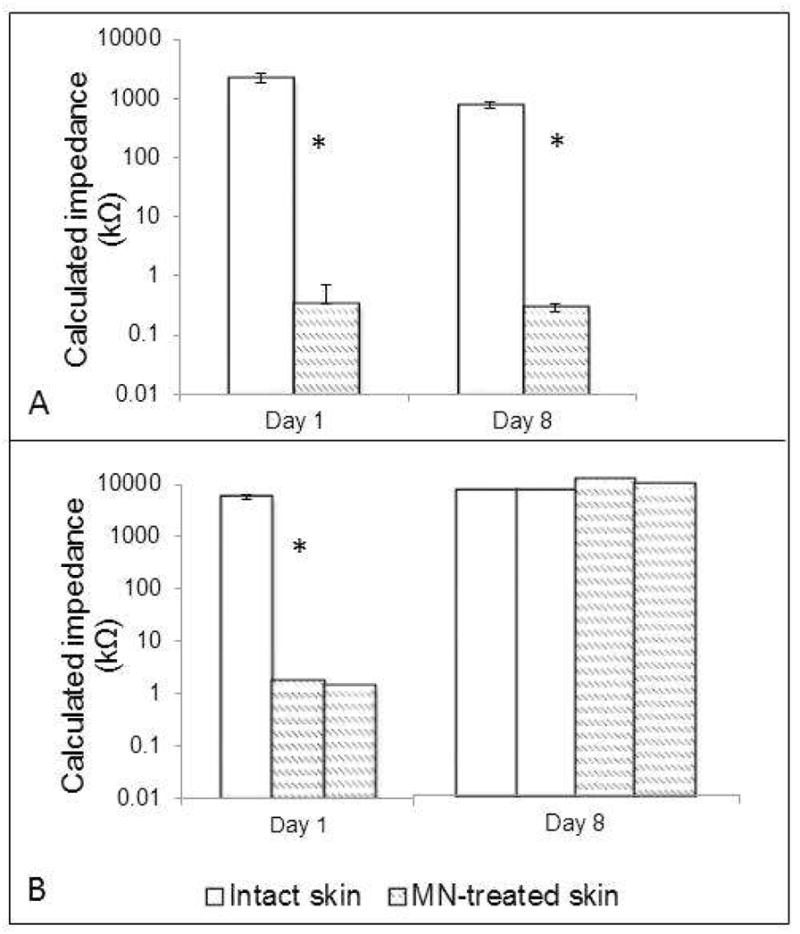
In both subjects, the Zpores decreased significantly from baseline to post-MN (signified by an asterisk), demonstrating a breach of the SC via the creation of micropores.
1A: Representative subject from Group 1. At the end of the study, a significant difference was still present between intact skin (white bars) and the MN-treated sites (hatched bars). All bars represent the mean of all 8 treatment sites.
1B: Represenative subject from Group 2. The Zpores had reached its upper limit by Day 8 in the subject from Group 2, confirming that the micropores had healed (thus preventing further drug delivery). On Day 1, the white bar (intact skin) represents the mean impedance of the 4 treatment sites; all other bars represent individual measurements at each site (the bars represent individual MN-treated sites, since subjects in this group only had 2 sites treated with MNs).