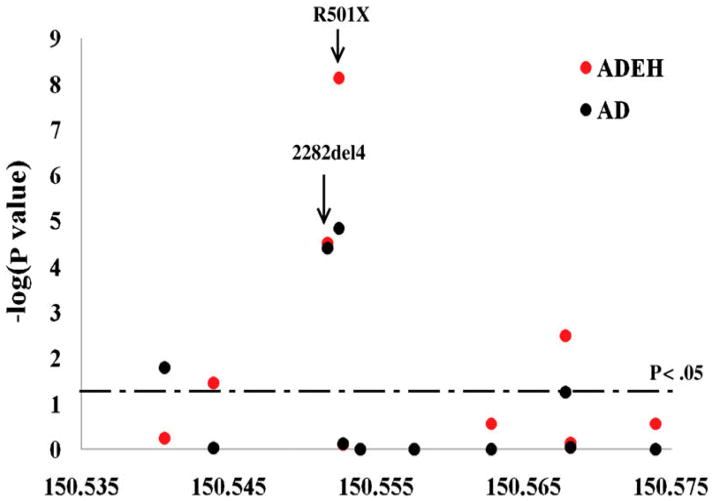
Figure 4.
Summary of association tests among European American subjects showing significance for each FLG mutation. The −log10-transformed P values on the y axis for all genotyped markers are plotted against their genomic position in NCBI Build 35 in megabase along the x axis. Red circles indicate associations for ADEH; green circles indicate associations for AD. The horizontal dotted line indicates nominal significance P < .05 (Gao, et al. 2009).

