Abstract
Drug resistance associated with dihydrofolate reductase (DHFR) has emerged as a critical issue in the treatment of bacterial infections. In our efforts to understand the mechanism of a drug-resistant dihydrofolate reductase (DHFR) from a pathogenic bacterial source, we report the first kinetic characterization of Streptococcus pneumoniae DHFR (spDHFR) along with its X-ray structure. This study revealed that the kinetic properties of spDHFR were significantly different from E. coli DHFR. The product (tetrahydrofolate) dissociation step that is the rate limiting step in the E. coli DHFR is significantly accelerated in spDHFR so that hydride transfer or a preceding step is rate limiting. Comparison of the binding parameters of this enzyme to a mutant spDHFR (Sp9) confirmed that the Leu100 residue in spDHFR is the critical element for the trimethoprim (TMP) resistance. Steady-state kinetics exhibited a pH dependence in kcat, which prompted us to elucidate the role of the new catalytic residue (His33) in the active site of spDHFR. Structural data of the Sp9 mutant in complex with NADPH and methotrexate confirmed the participation of His33 in a hydrogen bonding network involving a water molecule, the hydroxyl group of Thr119, and carboxylate ion of Glu30. Sequence analysis of the DHFR superfamily revealed that the His residue is the major amino acid component at this position and is found mostly in pathogenic bacterial DHFRs. A mutation of Val100 to Leu demonstrated a steric clash of the leucine side chain with the side chains of Ile8 and Phe34, rationalizing weaker binding of trimethoprim to Leu100 DHFR. Understanding the role of specific amino acids in the active site coupled with detailed structural analysis will inform us on how to better design inhibitors targeting drug resistant pathogenic bacterial DHFRs.
Streptococcus pneumoniae is one of the clinically important Gram-positive bacterial pathogens (1, 2). The emergence of multidrug-resistant (MDR) Streptococcus pneumoniae strains has become a global concern (3). Resistance to trimethoprim/sulphamethoxazole (T/S) arises from mutations in the target enzyme dihydrofolate reductase (DHFR), whose activity is necessary to maintain the cellular level of tetrahydrofolate that is essential for the biosynthesis of purines, some amino acids, and thymidine. Therefore, DHFR has long been a target for the discovery of novel antibacterial agents as well as anticancer drugs (4–8). Previous structural studies have demonstrated a high level of structural homology and a similarity in catalytic properties between human, parasitic and bacterial DHFRs in spite of the low sequence identities (9). In order to exploit the slight structural, sequence and activity differences between family members for inhibitor design, we determined the structure and turnover cycle for the Streptococcus pneumoniae DHFR (spDHFR) enzyme.
Trimethoprim (TMP), 5-substituted-2,4-diaminopyrimidine, is a selective inhibitor for bacterial DHFRs and has been widely used due to its broad spectrum of activity. Bacterial DHFRs bind TMP 2500-fold more tightly than human DHFR (0.08nM versus 200nM) (9). However, owing to the higher mutational rates of bacterial DHFRs, a large number of S. pneumoniae variants no longer bind the drug effectively as a consequence of mutations in the chromosomal DHFR gene (2). In general, TMP resistant clinical isolates have multiple mutations in spDHFR, but a single mutation at position 100 (I100L) has been implicated as a main contributor to drug resistance (10, 11). Our investigation of the kinetics and structure of spDHFR has provided valuable insights into the function of this position.
We present detailed pre-steady and steady state kinetic studies of spDHFR that have revealed the kinetic characteristics of this enzyme are significantly different from E. coli DHFR (12), and in turn prompted us to explore the X-ray structure of spDHFR in detail. We were able to crystallize the wild type enzyme as well as one mutant of DHFR with nine amino acids that differ from those in the wild type spDHFR sequence (Sp9, Figure 1A). The sequence of spDHFR aligned with E. coli and human DHFR is shown in Figure 1B. The sequence homology to those sequences is 35% and 26% identity, respectively. A comparison of the turnover kinetics and drug resistance of the two spDHFRs provides valuable information for improvements in drug design.
Figure 1.
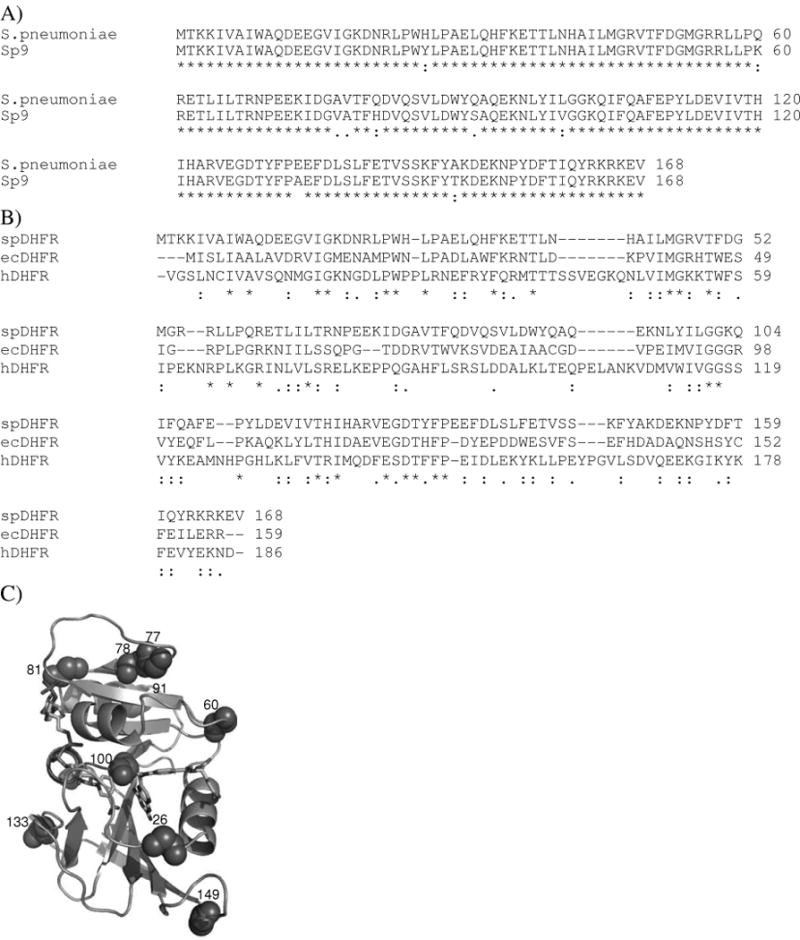
A) Sequence of spDHFR and the mutant Sp9. Note that the Sp9 mutant DHFR has Val-100 whereas the wild type S. pneumoniae DHFR has Leu at this position. A list of nine mutations from S. pneumoniae DHFR includes H26Y, Q60K, A77V, V78A, Q81H, Q91S, L100V, E133A, and A149T. B) Sequence alignment of DHFRs from S. pneumoniae (spDHFR), E. coli (ecDHFR), and human (hDHFR). Alignment was generated using ClustalW2 web server (http://www.ebi.ac.uk/Tools/clustalw2/index.html). C) The locations of the nine mutations in Sp9 DHFR. Note that most of these mutations are on the surface of the protein except the L100V mutation.
Materials and Methods
Plasmid and Construction of Mutant Proteins
The plasmids containing Sp9 DHFR mutant as well as wild type spDHFR were kindly gifted by Rama Ranganathan at the UT Southwestern Medical Center. The locations of the nine mutations in Sp9 are presented in Figure 1C. Site directed mutagenesis was carried out for the creation of the His33Phe spDHFR mutant as described in the protocol provided by Stratagene® instruction manual (http://www.stratagene.com).
Protein Expression and Purification
E. coli strain ER2566 (from NEB, IMPACT™ System) was modified to have a deletion of the DHFR gene (folA) and thymidylate synthethase (thyA) based on the protocol described in reference (13) and was used for the expression of the DHFR proteins. E. coli ER2566 ΔthyΔfol cells containing the DHFR genes in a pET28a vector were grown at 37 ºC to mid-log phase in 500 ml LB medium containing 50 μg/ml kanamycin and 50 μg/ml thymidine then induced at 18 ºC overnight with 0.1 mM IPTG. After induction, the cells were harvested by centrifugation. The cell pellet was resuspended in 10 ml of Lysis buffer (50 mM NaH2PO4, 300 mM NaCl, 10 mM imidazole pH 8.0) and sonicated on ice for 3 min. Centrifugation at 16,000 rpm at 4 ºC for 30 min yielded a clear lysate, which was incubated with ~2.5 ml Ni-NTA slurry at 4 ºC for 1hr by shaking at 200 rpm on a shaker. The lysate-Ni-NTA mixture was loaded into a column and the flow-through was collected. Following three washes with the above buffer, the DHFR protein was eluted with elution buffer (50 mM NaH2PO4, 300 mM NaCl, 250 mM imidazole pH 8.0). After dialysis against 25 mM Tris buffer (pH 7.5, 10% glycerol, 1 mM DTT), the protein solution was concentrated using an Amicon centrifugal filter giving ~20 mg of purified protein.
Steady-State Kinetic Measurement
The overall enzyme turnover rate (kcat) were measured on a Cary 100 BioUV-Vis spectrophotometer (Varian Inc.) at 25 ºC with a water-jacketed cuvette holder. All reactions were performed in a 1 mL reaction volume in MTEN buffer (50 mM 2-morpholinoethanesulfonic acid, 25 mM tris(hydroxymethyl)aminomethane, 25 mM ethanolamine and 100 mM NaCl), pH 7.0 containing 5 mM DTT. The enzyme was preincubated with 100 μM NADPH for 3 min, and then the reaction was initiated by adding 100 μM dihydrofolate. The decrease in absorbance was monitored at 340 nm (Δɛ340 =13.2 mM−1 cm−1).
KM values were determined by having either substrate or cofactor at a saturation and varying the other over a range of concentration. The pKa values were calculated from the equations 1 and 2 (14, 15):
| (1) |
| (2) |
NADPD Synthesis
For the kinetic isotope effect measurement, [(4′R)-2H]NADPH (NADPD) was synthesized by reduction of NADP+ using an NADP+-dependent alcohol dehydrogenase (purchased from Sigma) and 2-propanol-d8 (purchased from Aldrich) as described in reference (16).
TMP Inhibition Assay
The measurement of TMP inhibition was performed in the same instrument as described above. A TMP stock solution was dissolved in 50% DMSO solution and diluted with H2O. The enzyme was incubated with 100 μM NADPH at varying concentrations of TMP. The reaction was initiated by adding 10 μM of H2F to the reaction mixture and the decrease in absorbance owing to NADPH consumption was monitored. The IC50 was defined as the concentration of the TMP required to inhibit 50 % of enzyme activity. Determinations of IC50 were made by fitting the inhibition data to a single site sigmoidal model using the nonlinear regression method. The inhibition constant (Ki) were calculated from the equation Ki= IC50/(1+ [S]/KM) as previously described (17).
Stopped-flow Measurement for Pre-Steady State Kinetics
All transient or pre-steady state kinetic data were obtained by using a stopped-flow apparatus (Applied Photophysics Ltd.). Kinetic measurements were accomplished by exciting enzyme tryptophans at 290 nm and the resulting fluorescence was monitored using a 320 nm cut off filter or the FRET resulting from the cofactor fluorescence at 450 nm. The data were analyzed by single exponential curve fits to give the observed rate. Ligand dissociation rates were measured by the competition method (12). The ligands and traps used in these experiments can be found in the Results section.
Thermodynamic Dissociation Constants
The equilibrium dissociation constants (KD) were measured by the quenching of the intrinsic protein fluorescence as a function of ligand concentration using a Flouromax-2 or a Flouromax-4 (Horiba Jobin Yvon) spectrofluorometer. All the titration experiments were carried out in MTEN buffer at pH 7.0 containing 2 mM DTT. spDHFR has three tryptophan residues, which enables the measurement of tryptophan fluorescence at 340 nm from excitation at 290 nm. Enzyme concentrations were typically 25–100 nM. The fluorescence data were corrected for the inner filter effects and fit as described before (12, 18).
Crystallization and X-ray data collection
Robotic screening was done with 500 commercial screen conditions using the Phoenix crystallization robot. Crystals of the Sp9 mutant grew under two conditions: 1) 1 M lithium chloride, 0.1 M Na. citrate pH 4.0 and 20% PEG6K and 2) 1 M lithium sulfate, 0.1 M Tris pH 8.5, 0.01 M nickel chloride. Manual drops set up with the former condition resulted in 90 micron crystals that grew in 4 to 5 days. The crystals were screened using a home X-ray source consisting of a micromax 007 X-ray generator and Saturn 944+ CCD detector equipped with Varimax HF optics. The peak harvest time for crystals was seven to ten days. Sucrose saturated in mother liquor was found to be the most suitable cryo-condition giving the best diffraction. X-ray data diffraction data to 1.95 Å were collected at the home source. A 145 micron crystal of wild type protein grew from 30 % PEG MME (poly ethylene glycol monomethyl ether) 5000, 0.1 mM MES pH 6.5 and 0.2 M ammonium sulfate in 4 to 6 weeks. A 3.3 Angstroms low resolution X-ray data set was collected with this crystal.
Crystal structure solution and refinement
Sp9 Mutant
Data collection and processing was done using the Rigaku Crystalclear software (CrystalClear: An Integrated Program for the Collection and Processing of Area Detector Data, Rigaku Corporation, © 1997–2002, http://www.rigaku.com/software/ crystalclear.html). The crystallographic parameters are listed in Table 1. Further data processing and molecular replacement calculations were done with the Phaser program in the CCP4 package(19). Sequence alignment of Streptococcus pneumoniae DHFR (spDHFR) and Bacillus stearothermophilus DHFR (PDB code 1ZDR) (20) with 42% sequence identity was the best available molecular replacement model in the Protein Data Bank. Phaser with a 1ZDR monomer and not a dimer provided a solution for both molecules in the P21212 space group. The initial molecular replacement phases were improved by using the Phenix package(21). Density modification using solvent flattening and NCS averaging options were used. The electron density maps were visualized in the Coot program(22). Simulated annealing refinement using CNS program(23, 24) helped in overcoming phase bias. Coot and CNS programs were iteratively used for model correction and refinement. Model stereochemistry was checked using the Molprobity online server (http://molprobity.biochem.duke.edu/). The final R-factors after optimizing weights for refinement in the CNS package are r-cryst 0.237 and r-free 0.274. The PDB code for Sp9 is 3IX9.
Table 1.
Table of crystallographic parameters
| Unit Cell Parameters (Å) | a = 61.838, b = 93.639, c = 71.367 |
| Space group | P21212 |
| # of reflections observed | 67597 |
| # of unique reflections | 28610 |
| Linear merging R-factor (%) | 10.2 |
| Resolution of native data (Å) | 1.95 |
| # of molecules per asymmetric unit | 2 |
| Final R-cryst/R-free (%) | 23.7/27.4 |
| # of protein atoms | 2764 |
| # of water molecules | 306 |
| Ligand molecules | 2 methotrexate and 2 NADPH |
| rms deviation bonds (Å) | 0.01 |
| rms deviation angle (º) | 1.52 |
Wild type
The wild type protein crystal diffracted to 3.3 Å with cell dimensions of 134.27, 134.27, 219.88 Å in the hexagonal P6/P3 family of space groups. There are six to eight monomers in the asymmetric unit and this high number along with the low resolution of the X-ray data posed difficulty in the molecular replacement structure solution.
Results and Discussion
Kinetic Characterization of spDHFR
Steady-State Kinetics
Tables 2 and 3 summarize the kinetic parameters for spDHFR and its mutant Sp9 construct. The kcat of spDHFR at pH 7.0 is 2.5 fold faster than for E.coli DHFR (12). The overall turn over rate constant is 31.5 s−1 and exhibits a (kcat)H/(kcat)D of 2.4 at pH 7.0 (Table 2A). The kinetic isotope effect (KIE) value of 2.4 in spDHFR suggests that the hydride transfer step is at least partially rate limiting in the catalytic cycle even at neutral pH. Moreover, in stopped-flow protocols, a pre-steady state burst of product was not observed for the spDHFR. Its absence is consistent with the hydride transfer step or a preceding step being rate limiting followed by a subsequent rapid step so that product does not accumulate during the first turn over. On the other hand, the mutant Sp9 enzyme exhibits a KIE value of 1.1 that argues for the rate limiting step no longer being the chemistry step, even though the latter’s nine mutations decrease the catalytic activity of the enzyme by a factor of eight. The presence of a burst with small amplitude implicates a slower product (H4F) dissociation step contributing to the overall turnover rate, but further assessment of the each individual step in the catalytic cycle was hampered by the weak FRET signal.
Table 2.
Kinetic parameter for the S. pneumoniae DHFR and the mutant Sp9 at pH 7.0 in MTEN buffer.
| A) | |||
|---|---|---|---|
|
| |||
| Enzyme | kcat (s−1) | kcat (NH)/kcat (ND) | Kd (NADPH) (μM) |
| S. pneumoniae | 31.5 ± 2.5 | 2.4 ± 0.03 | 0.21 ± 0.013 |
| Sp9 | 3.8 ± 0.93 | 1.1 ± 0.05 | 0.16 ± 0.058 |
| E. coli (wt) | 12.0* | 1.0* | 0.33* |
| B) | |||||
|---|---|---|---|---|---|
|
| |||||
| Enzyme | KM (NADPH) (μM) | KM (H2F) (μM) | kcat (s−1) | kcat/KM(NADPH) (μM −1s−1) | kcat/KM (H2F) (μM −1s−1) |
| S. pneumoniae | 15.7 ± 4.6 | 4.4 ± 0.95 | 31.5 ± 2.5 | 2.0 | 7.2 |
| Sp9 | 0.75 ± 0.3 | < 0.63 | 3.8 ± 0.9 | 5.0 | > 6.0 |
| E. coli | 4.8 * | 0.7 * | 12.0 * | 2.5 | 17.1 |
Taken from reference 12.
Table 3.
Enzyme inhibition data for Trimethoprim against the S. pneumoniae and Sp9 mutant DHFR
| Enzyme | Ki (nM) | IC50 (nM) |
|---|---|---|
| S. pneumoniae | 147 ± 49 | 480 |
| Sp9 | 3.9 ± 0.5 | 130 |
The KM values of NADPH and H2F for the wild type spDHFR and the mutant Sp9 were measured (Table 2B). The KM values for the wild type spDHFR were at least order of magnitude higher than those for the Sp9 mutant that showed full enzyme activity even at a limiting low concentration of 0.63 μM H2F consistent with a much lower KM value for this substrate. It is not surprising to observe tighter ligand binding to the Sp9 mutant because the Sp9 mutant DHFR has Val100 whereas the wild type spDHFR has Leu at this position. This result is in accord with a previous finding (10, 11) that suggested the steric size of the amino acid side chain at position 100 affected ligand binding and its substitution may confer drug resistance on the enzyme. In the case of the Sp9 mutant, substitution by Val accommodates improved binding by the substrate and cofactor, reflecting less steric clash between substrate and position-100. Note that the specificity constants (kcat/KM) of Sp9 mutant enzyme are comparable to those of wild type since the decreased catalytic activity of Sp9 mutant enzyme is compensated for by the increased binding affinity to the ligands.
The Ki values for trimethoprim were determined as shown in Table 3. Changes in the catalytic efficiency caused by TMP binding were examined by incubating the enzymes with varied concentrations of TMP. Sp9 containing Val100 has a Ki value of 3.9 nM whereas wt spDHFR with Leu100 has 147 nM. The tighter binding of TMP to the Sp9 mutant DHFR than to wild type spDHFR presumably arises from increased accommodation of the drug because of the Val100 substitution, so that Sp9 is trimethoprim sensitive.
NADPH Binding to spDHFR
Fluorescence spectroscopy was employed to probe the binding of ligands to spDHFR and the Sp9 mutant. Titration of those proteins with NADPH resulted in a quenching of their intrinsic emission and provided the thermodynamic dissociation constants summarized in Table 2A. NADPH binds more tightly (ca. 2 fold) to spDHFR than E. coli DHFR. The Sp9 DHFR mutant retained this tight binding with NADPH, which strongly suggests that those nine mutations did not perturb significantly the enzyme structure.
The NADPH dissociation constant based on the relaxation method to measure the on and off rates was 1.5 μM (Table 4) while the value from equilibrium titration method was 0.21 μM. It is not uncommon to observe a difference between the two methods; the same is true for the E. coli enzyme albeit to a lesser extent. The DHFR enzyme is known to have multi conformations (25) in the absence of NADPH with the ligand binding to a preferred conformation. In the case of the E. coli DHFR, the apo enzyme exists in two conformational states (Ew and Et ) with an affinity difference to NADPH by over 100-fold. The isomerization process from inactive conformer (Ew) to active conformer (Et) was found to occur with a half life of 71 s while the conversion of Ew. NADPH to Et. NADPH occurs with a half life of 30 s (26). At equilibrium in the presence of NADPH, the enzyme conformations with tighter binding to NADPH will be predominant. Consequently, transient kinetic measurements with spDHFR shown in Table 4 may include the rates of isomerization between conformers in addition to ligand binding and dissociation leading to a disparity between the methods. Kinetic traces for NADPH binding fit to a single exponential and were not improved by a double exponential curve fit. One of the stopped-flow traces is presented in Figure 2A. Presumably, the data shown here were not resolved to a double exponential within the observed time scale.
Table 4.
Kinetic binding constants of NADPH to S. pneuminiae DHFR in MTEN buffer at 25 °C (relaxation method).
| kon (NADPH) (μM −1s−1) | koff (NADPH) (s−1) | koff/kon (μM) | |
|---|---|---|---|
| S. pneumoniae | 11.9 ± 1.4 | 18.0 ± 3.2 | 1.5 |
| E. coli DHFR | 20.0* | 3.5* | 0.18* |
Taken from reference (12).
Figure 2.
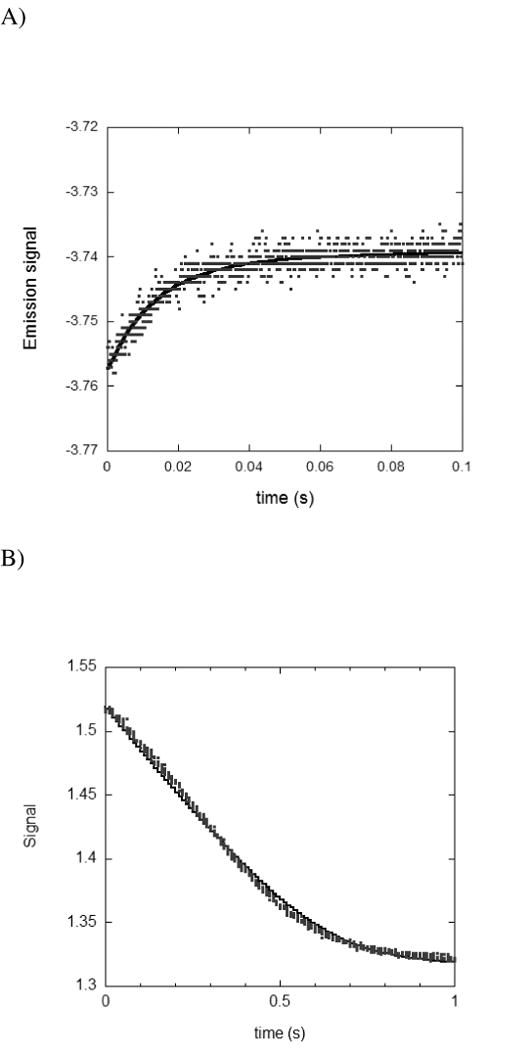
A) Stopped-flow time course for the binding of 0.5μM spDHFR with 5 μM NADPH at pH 7.0. Solid line represents the fit of the data to a single exponential function. B) Measurement of the time course for the hydride transfer rate catalyzed by spDHFR as monitored by stopped-flow absorbance. spDHFR was preincubated with NADPH and the reaction was initiated by mixing with H2F. The final concentrations were 5 μM, 100 μM, and 100 μM for enzyme, NADPH, and H2F, respectively at pH 7.0. The solid line represents the fit of the absorbance data by using Dynafit under the given experimental condition and kinetic parameters derived from this simulation are summarized in Table 6.
Quenching of the intrinsic fluorescence with the H2F binding in equilibrium did not produce data that can be fitted to a binding curve. The fluorescence signal was decreased upon addition of H2F, but the data were difficult to fit, which appeared to be related to slow conformational fluctuations upon binding.
Transient State Kinetics
Since dissociation of tetrahydrofolate (H4F) is the rate-limiting step in the wild type E.coli DHFR reaction pathway (12), the dissociation of ligands from various complexes was measured for spDHFR by a competition method (Table 5). The enzyme-ligand complex is mixed with a large excess of a second ligand (e.g. methotrexate, NADPH or NADP+). These two species of ligands compete for a common binding site so that under these conditions the dissociation rate of the bound ligand is equal to the observed rate (12).
Table 5.
Dissociation rate constants for ligands from wild type S. pneumoniae DHFR and Sp9 mutant at 25 °C in MTEN Buffer at pH 7.0.
| Enzyme | Ligand | Enzyme species | Trapping ligand | koff (s−1) pH 7.0 |
|---|---|---|---|---|
| S. pneumoniae (wt) | H4F | E.H4F.NH | MTX | ND* |
| E.H4F.N+ | MTX | 5.7 ± 0.4 | ||
| E.H4F | MTX | 3.8 ± 0.1 | ||
|
| ||||
| NADP+ | E.H4F.N+ | NADPH | > 250 † | |
|
| ||||
| NADPH | E.H4F.NH | NADP+ | ND* | |
|
| ||||
| Sp9 | H4F | E.H4F.NH | MTX | ND* |
| E.H4F.N+ | MTX | 12.0 ± 1.6 | ||
| E.H4F | MTX | 6.7 ± 0.2 | ||
Not determined due to the weaker signal.
The value is close to the experimental detection limit and estimated to be 400 s−1 from the simulation.
Scheme 1 depicts the kinetic scheme for spDHFR compared to E. coli DHFR incorporating the above data. In spDHFR, the H4F dissociation from either E.H4F.N+ or E.H4F is much slower than kcat. Moreover, the NADP+ dissociation rate from E.H4F.N+ ternary complex, which is on the pathway to form E.H4F.NH is much faster (>250 s−1) than that of H4F dissociation from the same ternary complex (5.7 s−1). This restricts the reaction pathway to the same inner loop of the reaction scheme as observed for E. coli DHFR. The H4F dissociation rate from the E.H4F.NH ternary complex FRET could not be determined by the competition method due to the weaker signal of the ternary complex and suspected high off rates.
Scheme 1.
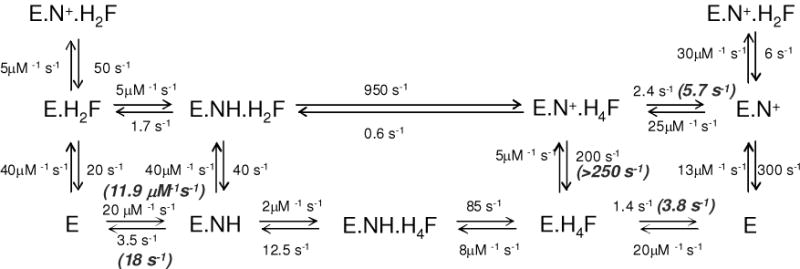
Schematic representation of E. coli DHFR reaction (12) and S. pneumoniae DHFR at pH 7.0. Highlighted with bold italic are the rate constants measured from experiments for S. pneumoniae DHFR. E = DHFR; NH = NADPH; H2F = 7, 8-dihydrofolate; H4F = tetrahydrofolate; N+ = NADP+
Since the rates for the chemistry step (E.NH.H2F → E.N+.H4F) and product dissociation step from the E.H4F.NH ternary complex could not be determined accurately, they were simulated by Dynafit (27) within the constraints imposed by kcat and the other dissociation constants (Table 6). Refer to Scheme 2 for the definitions of the rate constants. All the initial values for each of the rate constants were designated as adjustable fitting parameters except for k0 and k01 that were obtained from binding experiments. We started with initial values based on those of the E. coli DHFR, but no good fit was obtained. We then varied each rate constant one at a time through a wide range of initial values. The ranges of initial values as adjustable parameters that generated good curve fits are as follows; k1 = 40 μM−1 s−1, k11 = 40 s−1, k2 = 32 s−1, k21 = 0.1 s−1, k3 = 200–500 s−1, k4 = 8–10 μM−1 s−1, k41 = 100–200 s−1, k5 = 150–1000 s−1, k51 = 10– 40 μM−1 s−1.
Table 6.
Statistics of the simulated fits for the sp DHFR reaction pathway by Dynafit (27).
| k1 (μM−1s−1) | k11 (s−1) | k2 (s−1) | k21 (s−1) | k3 (s−1) | k4 (μM−1s−1) | k41 (s−1) | k5 (s−1) | k51 (μM−1s−1) | |
|---|---|---|---|---|---|---|---|---|---|
| Fit 1 | 26.2 | 34.0 | 38.5 | 0.0 | 299.4 | 5.6 | 649.6 | 2022.0 | 22.1 |
| Fit 2 | 25.9 | 27.3 | 40.0 | 14.4 | 447.3 | 4.7 | 477.6 | 1680.0 | 16.4 |
| Fit 3 | 25.6 | 28.9 | 38.1 | 0.0 | 447.8 | 4.7 | 445.5 | 1885.0 | 14.5 |
| Fit 4 | 19.5 | 48.3 | 38.8 | 0.0 | 461.9 | 4.5 | 411.2 | 839.6 | 22.3 |
| Fit 5 | 37.1 | 12.5 | 40.0 | 8.0 | 446.1 | 4.7 | 402.4 | 1540.0 | 43.7 |
| Fit 6 | 29.0 | 33.0 | 39.6 | 0.0 | 298.9 | 4.9 | 493.4 | 2180.0 | 19.8 |
|
| |||||||||
| Mean | 27.2 | 30.6 | 39.2 | 3.7 | 400.2 | 4.8 | 480.0 | 1691.1 | 23.1 |
| std | 5.8 | 11.6 | 0.8 | 6.1 | 78.5 | 0.4 | 90.4 | 476.3 | 10.5 |
Scheme 2.

Schematic representation of spDHFR reaction. The data were obtained from simulated fits as described in Table 6.
The simulation result was consistent with our experimental data, showing that hydride transfer step or a preceding step presumably involving a conformational change is participating as a rate-limiting step in spDHFR. Since no pre-steady state burst was observed in a multiple turnover condition by a stopped-flow measurement (Figure 2B), the dissociation rate constant of the H4F from the E.H4F.NH complex was estimated to be greater than 1600 s−1. The measured NADP+ dissociation rate from E.N+.H4F ternary complex by the stopped-flow measurement was close to the experimental detection limit (> 250 s−1). The data estimated from Dynafit simulation was 400 ± 79 s−1, which is reasonable since it is difficult to obtain an accurate rate constant around the experimental limit. The binding constants for the E.H4F.NH complex formed from binary complexes (either from E.H4F.or E.NH) were suggested to range from 70 to 100 μM based on the koff and kon ratio. The calculated specificity constant (kcat/KM (H2F)) obtained by using the following equation was ~ 4 μM −1s−1, which is comparable to the value of 7.2 μM−1s−1 from the experiment where KM = (k11k3)/(k1k2).
Our simulation data with the simplified model shown in scheme 2 produced larger error ranges for the fit along with a certain residual pattern. It is not unusual to see this uncertainty with nine variable parameters, which results from lack of experimental constraints due to the weaker fluorescence signal that had impeded further investigation for individual steps. Nonetheless, we have demonstrated that all of the independent fits with varied initial guesses converged to a certain range of rate constants presented in Table 6. We are aware that this postulated fitting model may have limitations (including significant error ranges for the fit along with a certain residual pattern), but we intended to demonstrate that the resultant model is consistent with our experimental data supporting the absence of a pre-steady state burst and that the hydride transfer or a preceding step limits the overall turnover rate. We can exclude the pathway where product dissociation is a rate limiting step as observed in E. coli DHFR. Taken together, the experimental and simulation results suggest that the E.H4F.NH ternary complex of spDHFR is less stable than in E. coli DHFR.
pH Dependence of Activity
The pH dependencies of wt spDHFR and the Sp9 mutant activity were investigated (Figure 3). The kcat of these two enzymes over the broad range of pH showed a pH-dependence in enzyme activity. A single maximum is observed ca. pH 7.0 for both enzymes. Bacterial DHFRs generally exhibit an optimum activity in the range of pH 6.0–6.5 while the enzymes from mammalian sources show optimum activity at pH 4.5–5.5 (28). In the case of the E. coli DHFR, the kcat was pH independent below pH 7.0 which was rationalized by the need for protonation of Asp27 in the active site (29). In contrast to E. coli DHFR, the maximum activity of the S. pneumoniae enzymes at pH 7.0 implies that there might be an ionizable residue participating in the enzyme turnover. Two pKa values of 6.2 and 7.9 were obtained by fitting the pH profile curve to equation 1 as described in the Materials and Methods (Figure 3A)(14). We surmised that the pKa of 6.2 may be attributed to the ionization of His33 placed at the active site of DHFR by our structural analysis. A mutant enzyme of spDHFR that has Phe in the 33 position (H33F) exhibits a similar pH dependence profile to that of E. coli DHFR (Figure 3B); the kcat values from pH 6.0 to 7.5 are pH-independent with a kcat value of 22.8 ± 2.2 s−1 and decrease in basic pH regions with a pKa of 8.2. This result suggests that His33 is participating in the active site as another ionizable group in spDHFR.
Figure 3.
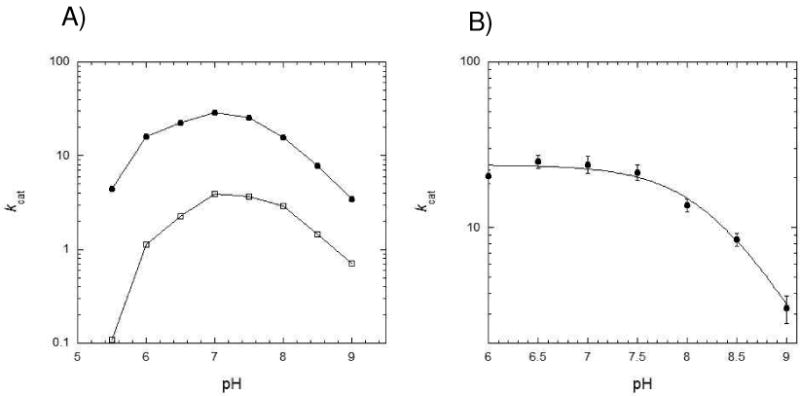
pH-rate profiles at 25 ºC in MTEN buffer. A) Both S. pneumoniae DHFRs (wild type •, Sp9 DHFR □) showed maximum activities at pH 7.0. The two pKa values of S. pneumoniae DHFR were calculated to be 6.2 and 7.9 from the curve fit equation 1 (14). B) The His33Phe mutant DHFR showed a similar pH profile to that of E. coli DHFR from reference (12) with a pKa value of 8.2 when fitted to equation 2 (15).
Analysis of the observed pKa of 7.9 draws on similar observations for other DHFR species. Firstly, the chemistry steps in E. coli, L. casei, and human DHFR have values of 950, 430, and 1360 s−1, respectively (12, 30, 31). The kcat values in Figure 3 are 31.5 s−1 and 22.8 s−1 for wt and the His33Phe mutant DHFR and are far slower than the usual value for the chemistry step. Secondly, the pKa value observed in plots of the actual chemical step (khydride) for the E. coli DHFR is 6.5, shifted down by 1.9 units from the value of 8.4 in a plot of kcat vs pH for the E. coli enzyme. This shift results from a change in the rate limiting step from the chemical step at high pH (> 8.4) to dissociation of H4F from the E.NH.H4F complex at low pH (<8.4).
For spDHFR the rate of the chemical step could not be measured by pre-steady state kinetic method owing to the absence of biphasic kinetics. However, measurements of the isotope effect kH/kD (NADPH vs NADPD) for the spDHFR enzyme varied in the order 1.0 (pH 6.0), 2.4 (pH 7.0), 3.8 (pH 9.0). These results support that the kcat for spDHFR at pH 7 incorporates the combination of a slow conformational change (E.NH.H2F→E’.NH.H2F) prior to the chemistry step and the actual hydride transfer step. At lower pH, the intrinsic hydride transfer rate should be much higher than that of kcat, so that a conformational change step limits the overall catalytic turnover as shown with a KIE value of 1.0. At higher pH, the chemical step limits the overall catalytic turnover with the KIE value of 3.8. Consequently the pKa shift observed in spDHFR is derived from a change in the rate limiting step from one of conformational change prior to the chemistry step to one of involving chemistry.
The kinetic studies described above revealed that the kinetic behavior of spDHFR is significantly different from E. coli DHFR; the H4F dissociation step which was the rate limiting step in the E. coli DHFR was accelerated by at least one hundred fold in the spDHFR. The pH dependence of the catalytic efficiency of spDHFR implicates different catalytic residue(s) in the binding site. The influence of the Histidine appears at lower pH (pKa 6.2) and its absence does not affect the rate observed for the wt and His33Phe mutants at the maxima in kcat (Fig 3B). Consequently it does not appear to facilitate the rate of the conformational step E.NH.H2F→E’.NH.H2F. The most likely role of the Histidine is revealed by the X-ray structure discussed below.
Description of Sp9 DHFR Structure
Overall Fold and Mobility
We discuss now the details of the crystal structure of the Sp9 DHFR mutant complexed with methotrexate and NADPH. The 1.95 Å structure of Sp9 has good geometry, a final R-factor and R-free of 23.7 and 27.4% respectively. The stereochemical quality of the protein structure was evaluated by the Molprobity server. The average B-factors are 29 Å for main chain and 33 Å for the side-chain and water molecules. The crystallographic parameters are listed in Table 1 in the Methods section. The sigma value for the electron density is 1.5.
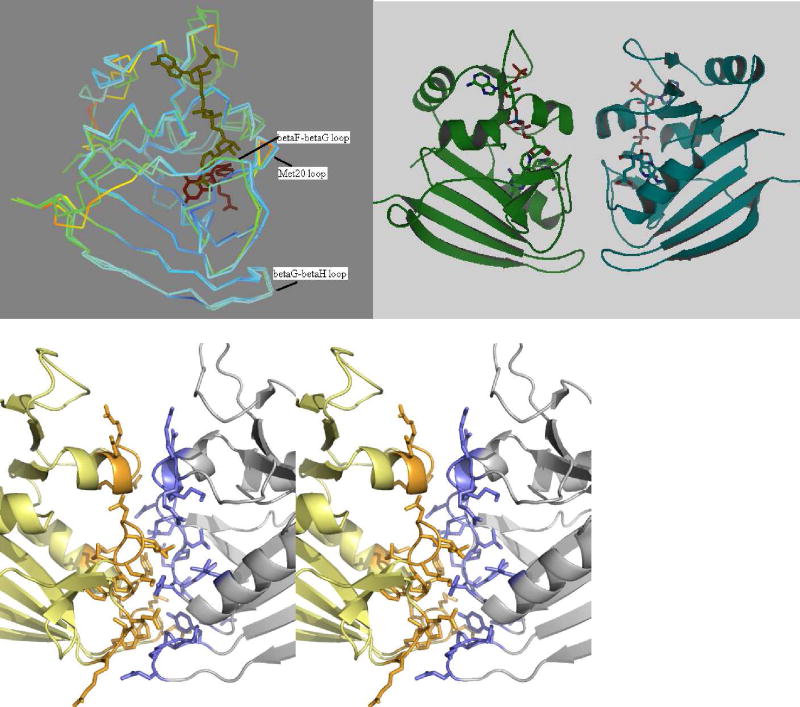
DHFRs from different species are known to have an overall low sequence identity of almost 20% but share the same general fold – a central β-sheet with four surrounding α-helices. The overall fold of the Sp9 mutant is similar to the fold of E. coli DHFR (32) as seen from an overlay diagram of the two monomers, Figure 4A. The two structures superpose well with RMS deviation of 1.02 Å for 148 backbone C-alpha atoms. The central β-sheet of Sp9 DHFR consists of eight parallel and two antiparallel strands. While the E. coli protein is a monomer, the Sp9 mutant is a tight dimer (Fig 4B) with a buried surface area of 708 Å2 (calculated with Areamol, part of the CCP4 package (19)). Molecular replacement with the dimer search model of Bacillus stearothermophilus DHFR (1ZDR, (20)), with which the spDHFR sequence shares the most homology (42% identity, 61% positives, and 2% gaps), failed to solve the structure of the Sp9 as the molecules dimerize in different orientations. Molecular replacement with a monomer of 1ZDR worked in solving the structure. Blast searches of spDHFR against DHFRs whose structures are known show the least homology with human DHFR (1U71) (33) (26% identity, 44% positives, and 12% gaps) yet good structural overlap.
Figure 4.
(a) Superposition of the E. coli and Sp9 DHFR monomers colored according to their temperature factors with red representing mobile regions and blue, the rigid regions. The substrate binding loops and helix in the E. coli structure seem to be more flexible compared to the Sp9 mutant. (b) Cartoon representation of the Sp9 DHFR dimer. (c) Stereo view of the dimer interface. Residues are shown in stick representation.
The loops (Met20 loop : residue 9–24, βF-βG loop : 117–131, βG-βH loop : 146–148) crucial in catalysis and substrate binding show higher mobility in the E. coli DHFR compared to the Sp9 DHFR as seen from a comparison of their relative crystallographic temperature factors (Figure 4A). Of the three loops, the Met20 loop and the βG-βH loop reside on the dimer interface accounting for their reduced mobility. The spDHFR Met20 loop is in the closed conformation. The two monomers of the dimer superpose on each other well with an RMS deviation of 0.62 Angstroms. Surface residues 69 to 76 and 132 to 139 shows the most variability in its conformation. These regions are however not in the vicinity of the active site.
Wild Type DHFR Model
The wild type protein crystal diffracted to 3.3 Å and has six to eight monomers in the asymmetric unit. This high number along with the low resolution of the X-ray data posed difficulty in solving the structure through the molecular replacement method. Through molecular modeling, we have introduced the wild type amino acids at the nine mutated positions of the Sp9 structure (Figure 1C). The residues were relaxed into their minimum energy conformers using the program Coot and remained close to the orientations of the corresponding Sp9 DHFR residues. The overall model was energy minimized using the GROMOS 43B1 force field in the Swisspdbviewer software (http://www.expasy.ch/). Eight of the nine mutations are on the surface of the protein with one mutation Val100 to Leu100 in the active site. The locations of the nine mutations are presented in Figure 1C. While the role of V100L mutation in the active site associated with ligand binding is evident from the X-ray structure, the role of other eight mutations located on the surface are not clear. The surface mutations may be responsible for the difference between the crystallization properties of the two crystal forms and their X-ray diffraction. We surmise that altered charge distribution on the surface of the protein may contribute to better crystal packing in Sp9.
Active Site Residues
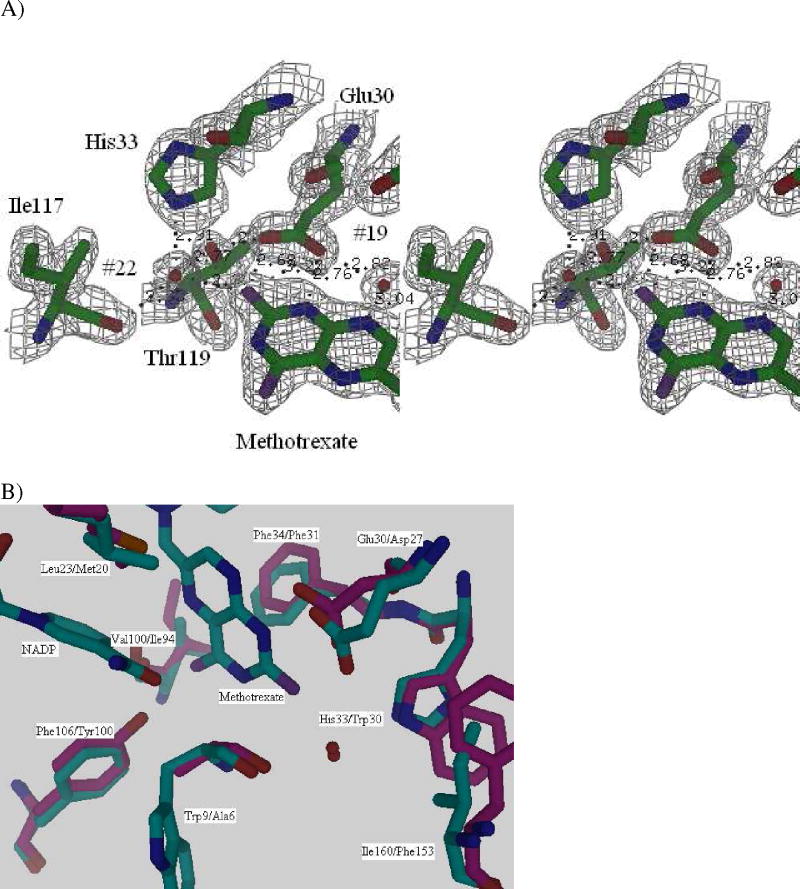
We have compared the structures of the Sp9 mutant (ternary complex with methotrexate and NADPH), and the published E. coli DHFR structure (1RH3 (32), also a ternary complex with methotrexate and NADPH). Between the published E. coli and the Sp9 active site structures, the change of His33 for Trp is the most noteworthy. This is consistent with our kinetic observations of a pH dependence in kcat for the wild type spDHFR. An inspection of the active site shows that His33 interacts with active site residues and the pteridine ring of the methotrexate through a hydrogen bonded network involving a water molecule (water #22, Fig 5A). A superposition diagram of the active sites of the E. coli (pdb code:1RH3) (32) and S. pneumoniae Sp9 structures is shown in Figure 5B.
Figure 5.
(a) Electron density shown as a stereoview for the active site region of the Sp9 DHFR mutant including His33 and Glu30 residues (sigma value of 1.5 ) and (b) Superposition of E. coli (pink) and spDHFR (cyan) – eight of the active site residues differ. The labeled amino acids are in the order S. pneumoniae DHFR Sp9 followed by the E. coli DHFR residue. Note that spDHFR has 168 amino acids while ecDHFR has 159 amino acids. This causes different numbering when comparing the two sequences.
Eight of the residues in the active site are different from E. coli DHFR. A listing of the active site residues with the spDHFR residue first and the E. coli next has Trp9/Ala6, Leu23/Met20, Glu30/Asp27, His33/Trp30, Phe34/Phe31, Val100/Ile94, Phe106/Tyr100 and Ile160/Phe153. Most residues have similar physical and chemical properties, but there is a dramatic difference between His33 and Trp30. His33 appears to stabilize the hydrogen bonding network to the carboxylate ion of Glu30 (Asp27 in E. coli DHFR) through the water molecule #22 as well as the hydroxyl group of Thr119. In the case of E. coli DHFR, the His33 replacement by Trp30 explains the pH independence below pH 7 for E. coli DHFR. Although the geometric configurations of the imidazole group of His33 and indole ring of Trp30 are similar, the nonionizable N5 atom from the indole group of Trp30 retains its hydrogen bonding network in the acidic pH region whereas the hydrogen bonding network is altered by protonation of His33 in spDHFR. Guided by this X-ray result, we generated a mutant enzyme of spDHFR that has Phe in the 33 position (His33Phe). As expected, this enzyme showed no pH dependence in the acidic pH range like E. coli DHFR (Figure 3B) confirming the participation of His 33 in the hydrogen bonding network.
The role of His33 is equivocal. The imidazole ring of His33 is braced with two hydrogen bonds associated with two water molecules (HOH#22 and HOH#93). At low pH, protonation of His33 might disrupt these hydrogen bonds affecting the transfer of a proton to the N5 position of H2F from Glu30 or the equilibrium protonation stage of the E.NH.H2F complex thus slowing kcat. The KIE measurement supported at low pH a conformational change step for the conversion of E.NH.H2F→E’.NH.H2F that alternatively might be inhibited by a protonated Histidine. This conformational step likewise may facilitate the proton transfer step as well as the final proton equilibrium to the N5 position within E.NH.H2F. Since the His33Phe mutant retains kcat, one minimally can conclude that the imidazole does not participate in the N5/Glutamate proton transfer process or equilibrium.
Conservation of His33 in the DHFR Superfamily
Composition analysis of the multiple sequence alignment of 125 DHFR superfamilies (cd00209) was carried out to see the evolutionary constraints on the active sites of DHFRs. The analysis revealed that the His residue is the most predominant residue in position 33 in active site (Figure 6). E. coli DHFR has Trp, while human and some organisms (e.g. yeast, fungi, and protozoa) have Tyr residue in that position. Further analysis of the sequences with His revealed it occurs mostly in bacterial DHFRs; 35 bacteria DHFRs along with 1 zebra fish and 1 virus sequence contain His at position 33, so that ~94% of the sequences with Histidine are found in bacteria. In addition, ~30 out of these 35 DHFRs are pathogenic bacteria (~86%). Consequently these bacteria have optimized their DHFRs to function at a physiological pH of 7.2 to 7.4.
Figure 6.
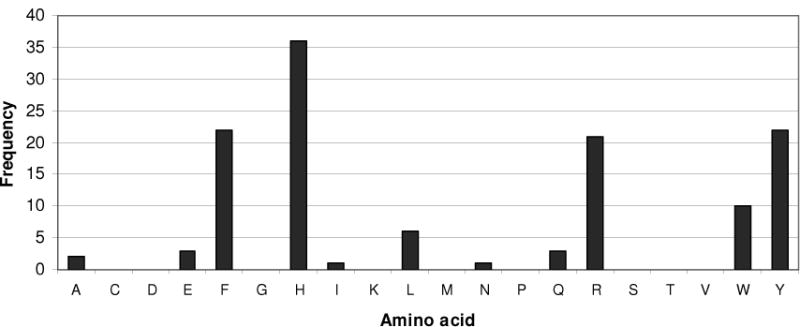
Amino acid distribution in the His33 position among members of the DHFR superfamily (cd00209). Further sequence analysis of this DHFR family revealed that the histidine residue is the major occupant of this position (see text).
The Ternary Complex of Wild Type spDHFR
In order to rationalize differences in the magnitude of the kinetic steps in the turnover cycle between the S. penumoniae and E. coli DHFRs, a comparison of the ternary complexes was undertaken. A structure of a complex of E. coli DHFR with 5,10 dideazatetrahydrofolate (DDF) and nicotinamide adenine dinucleotide phosphate (NADP+) (pdb code 1RX6) (32) was used as the starting model. The DDF molecule was modeled into the active site of wild type spDHFR based on a superposition of the two structures using Swisspdbviewer. The initial complex was energy minimized using the program CNS. A comparison of the E. coli (Figure 7A) and spDHFR (Figure 7B) ternary complexes showed that the substrate analog in the E. coli active site was more tightly bound compared to the S. pneumoniae active site. The folate ring and the residues at the active site in the immediate vicinity were stabilized by seven hydrogen bond interactions in the E. coli structure versus three hydrogen bonds in the spDHFR (marked as dashes in Figure 7). The two share an equal number of van der Waals contacts. This provides a plausible structural explanation for the weaker binding of H2F (in terms of KM= 4.4 vs. 0.7 μM) and the more rapid dissociation of H4F (> 1600 s−1 vs. 12 s−1). The weaker binding of ligands implicated in this model, however, does not appear to impact the hydride transfer rate that we estimate by extrapolation of kcat in Figure 3B (the decreasing pH limb) to a pKa<7 is >1000 s−1.
Figure 7.
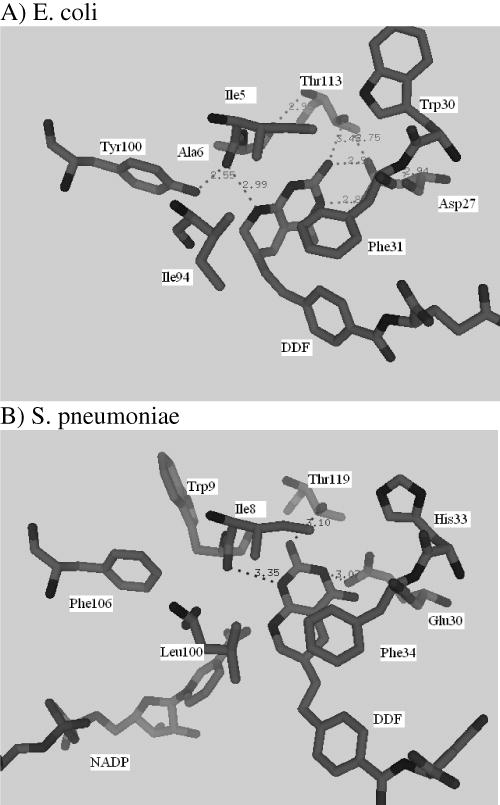
Ternary complex as seen in the E. coli crystal structure with dideazatetrahydrofolate (DDF) (A) and an energy minimized model of S. pneumoniae with DDF and NADPH (B).
Val/Ile100→Leu mutation and Trimethoprim Resistance
Earlier studies on trimethoprim resistance in DHFRs have indicated that position100 is crucial (10, 11) as seen from the structure of Mycobacterium tuberculosis DHFR complexed with NADPH and trimethoprim (pdb code:1DG5, (34)). The trimethoprim molecule is tightly bound in the active site by a stacking interaction with the Phe31 ring and four hydrogen bonds (black dashes in Figure 8) involving residues Ile94, Ile5 and Asp27. The side-chains of Ile94 and Phe31 are in van der Waals contact. A superposition of the spDHFR Sp9 mutant onto the active site of Mycobacterium tuberculosis DHFR showed that Val100, Ile8, Phe34 and Glu30 are in superimposable positions. A simple mutation of Val100 to Leu shows that the leucine side chain sterically clashes with the side chains of Ile8 and Phe34 (red dashes in Figure 8) and shifts their positions, thus destabilizing hydrogen bonding and stacking interactions with the trimethoprim molecule. Weaker binding of trimethoprim to Leu100 DHFR would lead to trimethoprim resistance. The inhibition study of spDHFRs by TMP (Table 3 and Figure 9) is consistent with the effect of the Leu100 residue in wild type spDHFR on TMP binding (Ki values are 147 vs. 3.9 nM for wt and Sp9). The TMP sensitivity of Sp9 appears to be analogous to those of TMP sensitive bacterial DHFRs, suggesting the retention of the hydrogen bonding and stacking interactions with the 2,4 amino pyridine ring of TMP illustrated in Figure 8.
Figure 8.
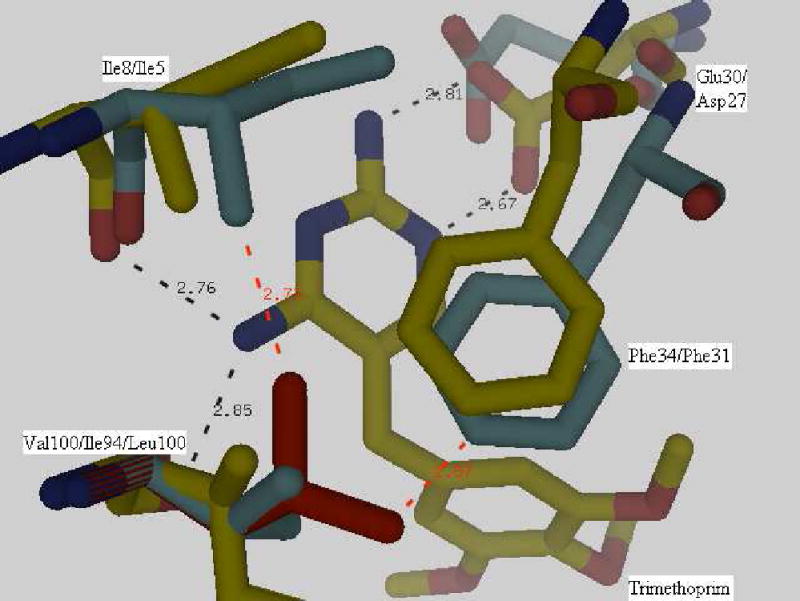
Superposition of the Streptococcus pneumoniae DHFR Sp9 structure and a complex of Mycobacterium tuberculosis DHFR with trimethoprim (1DG5). Val100 in Streptococcus pneumoniae DHFR Sp9 and Ile94 in Mycobacterium tuberculosis DHFR showed stacking (Phe with the pyrimidine ring of trimethoprim) and hydrogen bond interactions (black dashes). No steric clashes occur. Mutation of Val100 to Leu100 as seen in the wild type protein results in a steric clash of the side-chains (red dashes). The first numbered label in the figure is the S. pneumoniae DHFR Sp9 mutant residue and the second is 1DG5.
Figure 9.
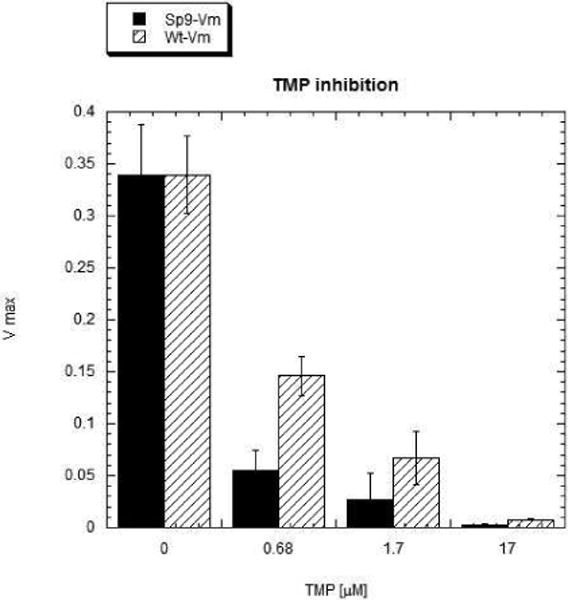
S. pneumoniae DHFR activity decreased by TMP binding at pH 7.0 in MTEN buffer.
Collectively, the data presented herein have deepened our understanding of the relationship between structure and enzyme catalysis. The kinetic properties of the drug resistant S. pneumoniae DHFRs and the mutant DHFR (Sp9) have been characterized in detail in conjunction with structural analysis from X-ray crystallography. The enzymes exhibit unique kinetic properties that are significantly different from those of E. coli DHFR: the rate limiting step is the hydride transfer step and/or preceding step and not dissociation of H4F; the pH dependent kinetics can be assigned to participation of an active site His residue; substitution at the Leu100 position significantly influenced the ligand binding off-rate and correlated with trimethoprim resistance. The insight gained from current work will help in the design of new inhibitors targeting drug resistant pathogenic bacterial DHFRs.
Acknowledgments
This project is funded, in part, under a grant with the Pennsylvania Department of Health using Tobacco Settlement Funds. The Department specifically disclaims responsibility for any analyses, interpretations or conclusions.
Abbreviations
- DHFR
dihydrofolate reductase
- sp
Streptococcus pneumoniae
- TMP
trimethoprim
- MTX
methotrexate
- NADPH
nicotinamide adenine dinucleotide phosphate (reduced form)
- H2F
7, 8-dihydrofolate
- H4F
tetrahydrofolate
- DDF
dideazatetrahydrofolate
References
- 1.Hawser S, Lociuro S, Islam K. Dihydrofolate reductase inhibitors as antibacterial agents. Biochem Pharmacol. 2006;71:941–948. doi: 10.1016/j.bcp.2005.10.052. [DOI] [PubMed] [Google Scholar]
- 2.Pikis A, Donkersloot JA, Rodriguez WJ, Keith JM. A conservative amino acid mutation in the chromosome-encoded dihydrofolate reductase confers trimethoprim resistance in Streptococcus pneumoniae. J Infect Dis. 1998;178:700–706. doi: 10.1086/515371. [DOI] [PubMed] [Google Scholar]
- 3.Zhanel GG, Wang X, Nichol K, Nikulin A, Wierzbowski AK, Mulvey M, Hoban DJ. Molecular characterisation of Canadian paediatric multidrug-resistant Streptococcus pneumoniae from 1998–2004. Int J Antimicrob Agents. 2006;28:465–471. doi: 10.1016/j.ijantimicag.2006.08.005. [DOI] [PubMed] [Google Scholar]
- 4.Laue H, Weiss L, Bernardi A, Hawser S, Lociuro S, Islam K. In vitro activity of the novel diaminopyrimidine, iclaprim, in combination with folate inhibitors and other antimicrobials with different mechanisms of action. J Antimicrob Chemother. 2007;60:1391–1394. doi: 10.1093/jac/dkm409. [DOI] [PubMed] [Google Scholar]
- 5.Frey KM, Liu J, Lombardo MN, Bolstad DB, Wright DL, Anderson AC. Crystal structures of wild-type and mutant methicillinresistant Staphylococcus aureus dihydrofolate reductase reveal an alternate conformation of NADPH that may be linked to trimethoprim resistance. J Mol Biol. 2009;387:1298–1308. doi: 10.1016/j.jmb.2009.02.045. [DOI] [PMC free article] [PubMed] [Google Scholar]
- 6.Kohlhoff SA, Sharma R. Iclaprim. Expert Opin Investig Drugs. 2007;16:1441–1448. doi: 10.1517/13543784.16.9.1441. [DOI] [PubMed] [Google Scholar]
- 7.Periti P. Brodimoprim, a new bacterial dihydrofolate reductase inhibitor: a minireview. J Chemother. 1995;7:221–223. doi: 10.1179/joc.1995.7.3.221. [DOI] [PubMed] [Google Scholar]
- 8.Oefner C, Bandera M, Haldimann A, Laue H, Schulz H, Mukhija S, Parisi S, Weiss L, Lociuro S, Dale GE. Increased hydrophobic interactions of iclaprim with Staphylococcus aureus dihydrofolate reductase are responsible for the increase in affinity and antibacterial activity. J Antimicrob Chemother. 2009;63:687–698. doi: 10.1093/jac/dkp024. [DOI] [PubMed] [Google Scholar]
- 9.Volpato JP, Pelletier JN. Mutational ‘hot-spots’ in mammalian, bacterial and protozoal dihydrofolate reductases associated with antifolate resistance: sequence and structural comparison. Drug Resist Updat. 2009;12:28–41. doi: 10.1016/j.drup.2009.02.001. [DOI] [PubMed] [Google Scholar]
- 10.Adrian PV, Klugman KP. Mutations in the dihydrofolate reductase gene of trimethoprim-resistant isolates of Streptococcus pneumoniae. Antimicrob Agents Chemother. 1997;41:2406–2413. doi: 10.1128/aac.41.11.2406. [DOI] [PMC free article] [PubMed] [Google Scholar]
- 11.Maskell JP, Sefton AM, Hall LM. Multiple mutations modulate the function of dihydrofolate reductase in trimethoprim-resistant Streptococcus pneumoniae. Antimicrob Agents Chemother. 2001;45:1104–1108. doi: 10.1128/AAC.45.4.1104-1108.2001. [DOI] [PMC free article] [PubMed] [Google Scholar]
- 12.Fierke CA, Johnson KA, Benkovic SJ. Construction and evaluation of the kinetic scheme associated with dihydrofolate reductase from Escherichia coli. Biochemistry. 1987;26:4085–4092. doi: 10.1021/bi00387a052. [DOI] [PubMed] [Google Scholar]
- 13.Datsenko KA, Wanner BL. One-step inactivation of chromosomal genes in Escherichia coli K-12 using PCR products. Proceedings of the National Academy of Sciences of the United States of America. 2000;97:6640–6645. doi: 10.1073/pnas.120163297. [DOI] [PMC free article] [PubMed] [Google Scholar]
- 14.Roychowdhury-Saha M, Burke DH. Extraordinary rates of transition metal ion-mediated ribozyme catalysis. Rna. 2006;12:1846–1852. doi: 10.1261/rna.128906. [DOI] [PMC free article] [PubMed] [Google Scholar]
- 15.Murphy DJ, Benkovic SJ. Hydrophobic interactions via mutants of Escherichia coli dihydrofolate reductase: separation of binding and catalysis. Biochemistry. 1989;28:3025–3031. doi: 10.1021/bi00433a043. [DOI] [PubMed] [Google Scholar]
- 16.Jeong SS, Gready JE. A method of preparation and purification of (4R)-deuterated-reduced nicotinamide adenine dinucleotide phosphate. Anal Biochem. 1994;221:273–277. doi: 10.1006/abio.1994.1411. [DOI] [PubMed] [Google Scholar]
- 17.Cody V, Pace J, Makin J, Piraino J, Queener SF, Rosowsky A. Correlations of Inhibitor Kinetics for Pneumocystis jirovecii and Human Dihydrofolate Reductase with Structural Data for Human Active Site Mutant Enzyme Complexes. Biochemistry. 2009;48:1702–1711. doi: 10.1021/bi801960h. [DOI] [PMC free article] [PubMed] [Google Scholar]
- 18.Lakowicz JR. Principles of fluorescence spectroscopy. 3. Springer; 2006. [Google Scholar]
- 19.McCoy AJ, Grosse-Kunstleve RW, Adams PD, Winn MD, Storoni LC, Read RJ. Phaser crystallographic software. J Appl Crystallogr. 2007;40:658–674. doi: 10.1107/S0021889807021206. [DOI] [PMC free article] [PubMed] [Google Scholar]
- 20.Kim HS, Damo SM, Lee SY, Wemmer D, Klinman JP. Structure and hydride transfer mechanism of a moderate thermophilic dihydrofolate reductase from Bacillus stearothermophilus and comparison to its mesophilic and hyperthermophilic homologues. Biochemistry. 2005;44:11428–11439. doi: 10.1021/bi050630j. [DOI] [PubMed] [Google Scholar]
- 21.Zwart PH, Afonine PV, Grosse-Kunstleve RW, Hung LW, Ioerger TR, McCoy AJ, McKee E, Moriarty NW, Read RJ, Sacchettini JC, Sauter NK, Storoni LC, Terwilliger TC, Adams PD. Automated structure solution with the PHENIX suite. Methods Mol Biol. 2008;426:419–435. doi: 10.1007/978-1-60327-058-8_28. [DOI] [PubMed] [Google Scholar]
- 22.Emsley P, Cowtan K. Coot: model-building tools for molecular graphics. Acta Crystallogr D Biol Crystallogr. 2004;60:2126–2132. doi: 10.1107/S0907444904019158. [DOI] [PubMed] [Google Scholar]
- 23.Brunger AT, Adams PD, Clore GM, DeLano WL, Gros P, Grosse-Kunstleve RW, Jiang JS, Kuszewski J, Nilges M, Pannu NS, Read RJ, Rice LM, Simonson T, Warren GL. Crystallography & NMR system: A new software suite for macromolecular structure determination. Acta Crystallogr D Biol Crystallogr. 1998;54:905–921. doi: 10.1107/s0907444998003254. [DOI] [PubMed] [Google Scholar]
- 24.Brunger AT. Version 1.2 of the Crystallography and NMR system. Nat Protoc. 2007;2:2728–2733. doi: 10.1038/nprot.2007.406. [DOI] [PubMed] [Google Scholar]
- 25.Cameron CE, Benkovic SJ. Evidence for a functional role of the dynamics of glycine-121 of Escherichia coli dihydrofolate reductase obtained from kinetic analysis of a site-directed mutant. Biochemistry. 1997;36:15792–15800. doi: 10.1021/bi9716231. [DOI] [PubMed] [Google Scholar]
- 26.Appleman JR, Howell EE, Kraut J, Blakley RL. Role of aspartate 27 of dihydrofolate reductase from Escherichia coli in interconversion of active and inactive enzyme conformers and binding of NADPH. J Biol Chem. 1990;265:5579–5584. [PubMed] [Google Scholar]
- 27.Kuzmic P. Program DYNAFIT for the analysis of enzyme kinetic data: application to HIV proteinase. Anal Biochem. 1996;237:260–273. doi: 10.1006/abio.1996.0238. [DOI] [PubMed] [Google Scholar]
- 28.Dann JG, Ostler G, Bjur RA, King RW, Scudder P, Turner PC, Roberts GC, Burgen AS. Large-scale purification and characterization of dihydrofolate reductase from a methotrexate-resistant strain of Lactobacillus casei. Biochem J. 1976;157:559–571. doi: 10.1042/bj1570559. [DOI] [PMC free article] [PubMed] [Google Scholar]
- 29.Howell EE, Villafranca JE, Warren MS, Oatley SJ, Kraut J. Functional role of aspartic acid-27 in dihydrofolate reductase revealed by mutagenesis. Science. 1986;231:1123–1128. doi: 10.1126/science.3511529. [DOI] [PubMed] [Google Scholar]
- 30.Andrews J, Fierke CA, Birdsall B, Ostler G, Feeney J, Roberts GC, Benkovic SJ. A kinetic study of wild-type and mutant dihydrofolate reductases from Lactobacillus casei. Biochemistry. 1989;28:5743–5750. doi: 10.1021/bi00440a007. [DOI] [PubMed] [Google Scholar]
- 31.Appleman JR, Beard WA, Delcamp TJ, Prendergast NJ, Freisheim JH, Blakley RL. Unusual transient- and steady-state kinetic behavior is predicted by the kinetic scheme operational for recombinant human dihydrofolate reductase. J Biol Chem. 1990;265:2740–2748. [PubMed] [Google Scholar]
- 32.Sawaya MR, Kraut J. Loop and subdomain movements in the mechanism of Escherichia coli dihydrofolate reductase: crystallographic evidence. Biochemistry. 1997;36:586–603. doi: 10.1021/bi962337c. [DOI] [PubMed] [Google Scholar]
- 33.Cody V, Luft JR, Pangborn W. Understanding the role of Leu22 variants in methotrexate resistance: comparison of wild-type and Leu22Arg variant mouse and human dihydrofolate reductase ternary crystal complexes with methotrexate and NADPH. Acta Crystallogr D Biol Crystallogr. 2005;61:147–155. doi: 10.1107/S0907444904030422. [DOI] [PubMed] [Google Scholar]
- 34.Li R, Sirawaraporn R, Chitnumsub P, Sirawaraporn W, Wooden J, Athappilly F, Turley S, Hol WG. Three-dimensional structure of M. tuberculosis dihydrofolate reductase reveals opportunities for the design of novel tuberculosis drugs. J Mol Biol. 2000;295:307–323. doi: 10.1006/jmbi.1999.3328. [DOI] [PubMed] [Google Scholar]


