Figure 3.

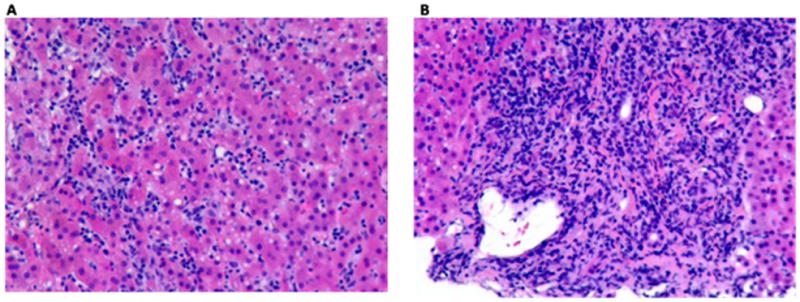
Figure 3A and 3B: Liver Biopsy of subject # 4
Sections of the liver with H&E stain viewed under light microscopy and high power field.
Figure 3A: The lobules showed marked inflammatory infiltrate which consisted of necroinflammatory foci as well as prominent infiltration of sinusoids by lymphocytes.
Figure 3B: A heavy lymphocytic inflammatory infiltrate was present in portal tracts and this infiltrate breached the limiting plate. Endothelitis was seen and the bile ducts were preserved.
