
Figure 6.
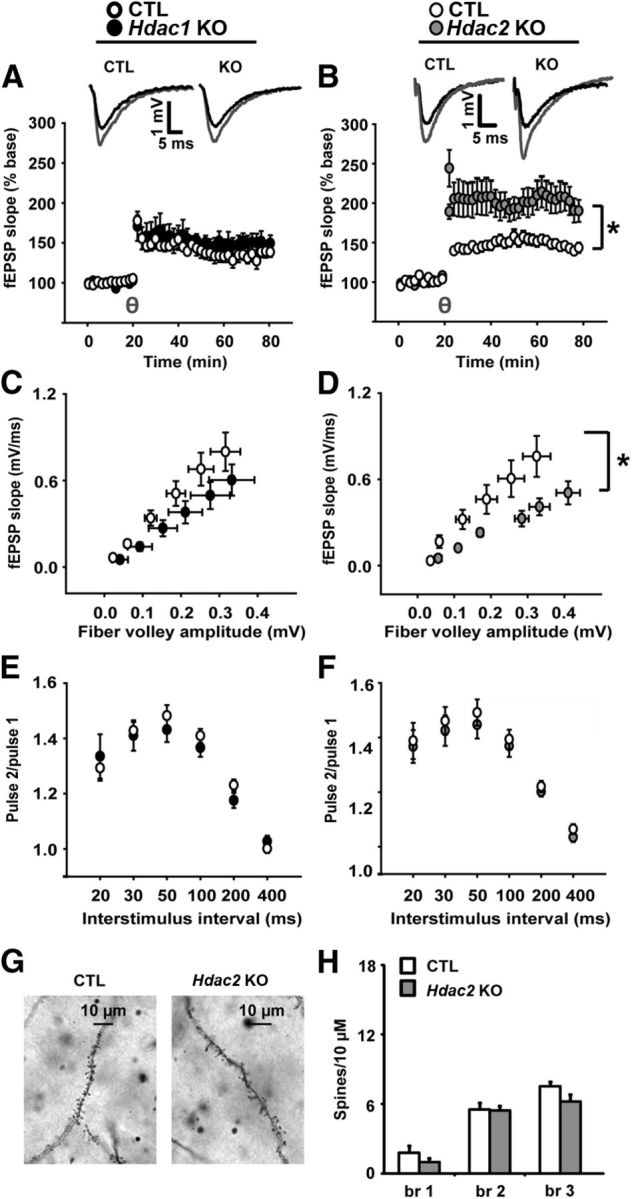
Hippocampal slice properties and dendritic spine counts. A, LTP induced by θ burst stimulation was normal in Hdac1 KO compared with CTL (A). B, By contrast, Hdac2 KO robustly increased the magnitude of LTP relative to CTL slices. C, D, The input–output slopes in Hdac1 KO slices showed a nonstatistically significant trend toward depression relative to CTL (p = 0.161). Slopes from Hdac2 KO slices were significantly depressed compared with CTL slices. E, F, PPF was normal in both Hdac1 and Hdac2 KO mice. One to 4 slices were used per animal with the following number of slices used for the experiments: for input–output slopes, Hdac1 KO (n = 16), Hdac2 KO (n = 9), CTLs (n = 17 and n = 14, respectively); for PPF, Hdac1 KO (n = 10), Hdac2 KO (n = 8), CTLs (n = 10 and n = 8, respectively); for LTP, Hdac1 KO (n = 11), Hdac2 KO (n = 11), CTLs (n = 9 and n = 8, respectively). G, Representative pictures (100×) of dendritic spines in Hdac2 KO and CTL. H, There were no differences in number of spines per 10 μm for dendrite branch 1 (br 1), br 2, or br 3 in Hdac2 KOs (n = 5) compared with CTL (n = 5). Because of a lack of electrophysiological or behavioral phenotype, Hdac1 KOs were not assessed. θ = induction of LTP by θ burst stimulation after 20 min of stable baseline. *p < 0.05.