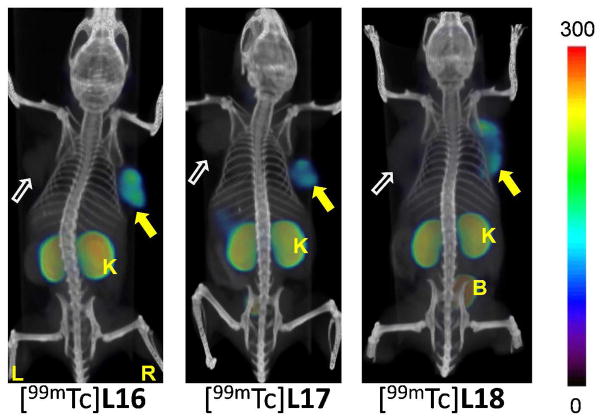
Figure 4.
Whole body SPECT-CT imaging of PSMA+ PC3 PIP and PSMA− PC3 flu tumor-bearing mice with [99mTc]L16, [99mTc]L17 and [99mTc]L18 at 2 h post-injection, respectively. Mice were injected with ~ 37 MBq (1 mCi) of radiopharmaceutical IV. PIP = PSMA+ PC3 PIP (filled arrow); flu = PSMA− PC3 flu (unfilled arrow); K= kidney; B = bladder; L = left; R = right. All images are decay-corrected and adjusted to the same maximum scale.

