
Figure 4.
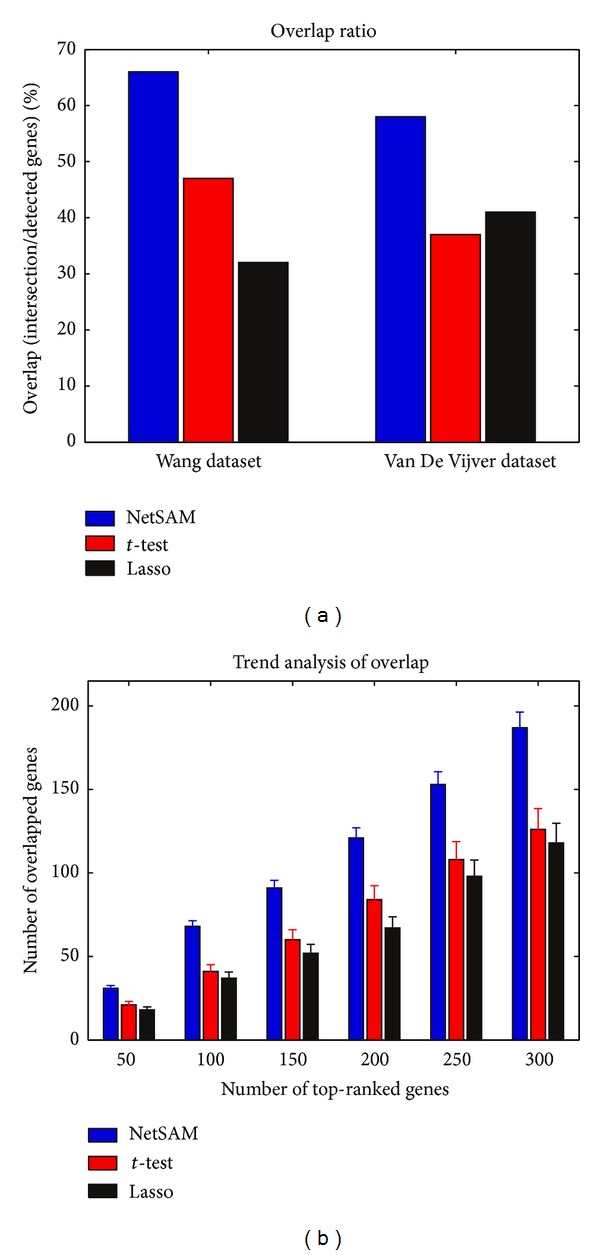
(a) Overlaps of the identified genes using netSAM, t-test, and lasso based on Wang et al. and Van De Vijver et al. breast cancer datasets. (b) Trend of overlap: number of overlapped genes versus top-ranked genes (error bars denote standard deviation estimated over 100 tests).