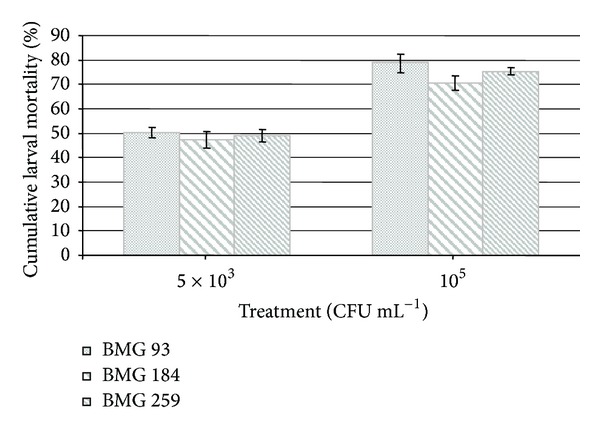
Figure 5.

Larval mortality rate after exposure to the pathogen P. larvae. Graphical representation of cumulative mortality percentage of larvae (± SD), fed with artificial diet supplemented with P. larvae spores at 5 × 10³ CFU mL−1 or 105 CFU mL−1, during 8 days. In Y-axis the mortality percentage of larvae reported, and in X axis the different P. larvae strains used of larval infection tested at the two spore concentrations are reported.
