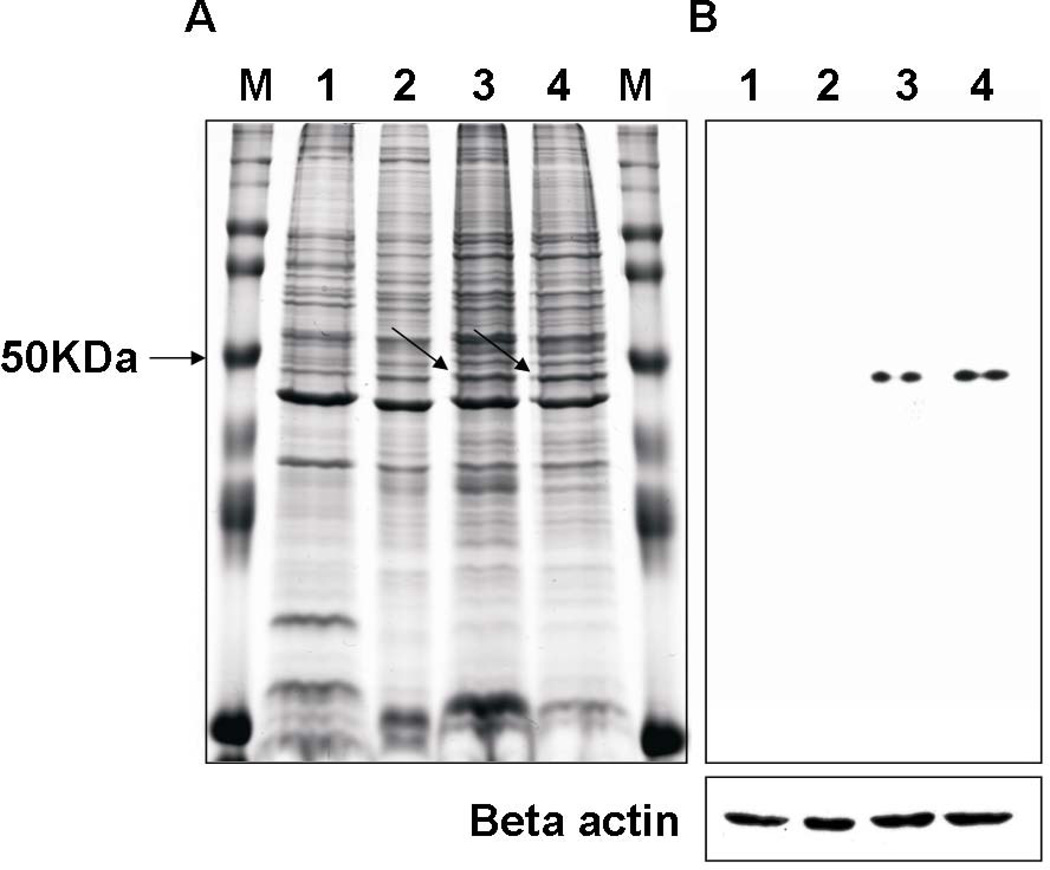
Fig. 2.
SDS-PAGE and immunoblot analysis of cell lysates from SEC1-stimulated bovine PBMCs. Bovine PBMCs were exposed to SEC1 (5 ng/ml) for up to 8 d. PBMCs were harvested at 2, 4, 6, or 8 d of culture. Cell lysates were resolved by SDS-PAGE and stained with Coomassie Blue (A) or transferred to membranes and probed with FOX20A mAb (B). panel A, arrows indicate location of bands corresponding to the bands detected in immunoblots (panel B). Lane M, prestained markers (Invitrogen); Lane1, 2, 3, and 4 represent lysates from days 2, 4, 6, and 8, respectively. To ensure equal sample loading, membranes were stripped and reprobed with an anti-beta actin mAb (Beta actin panel).

