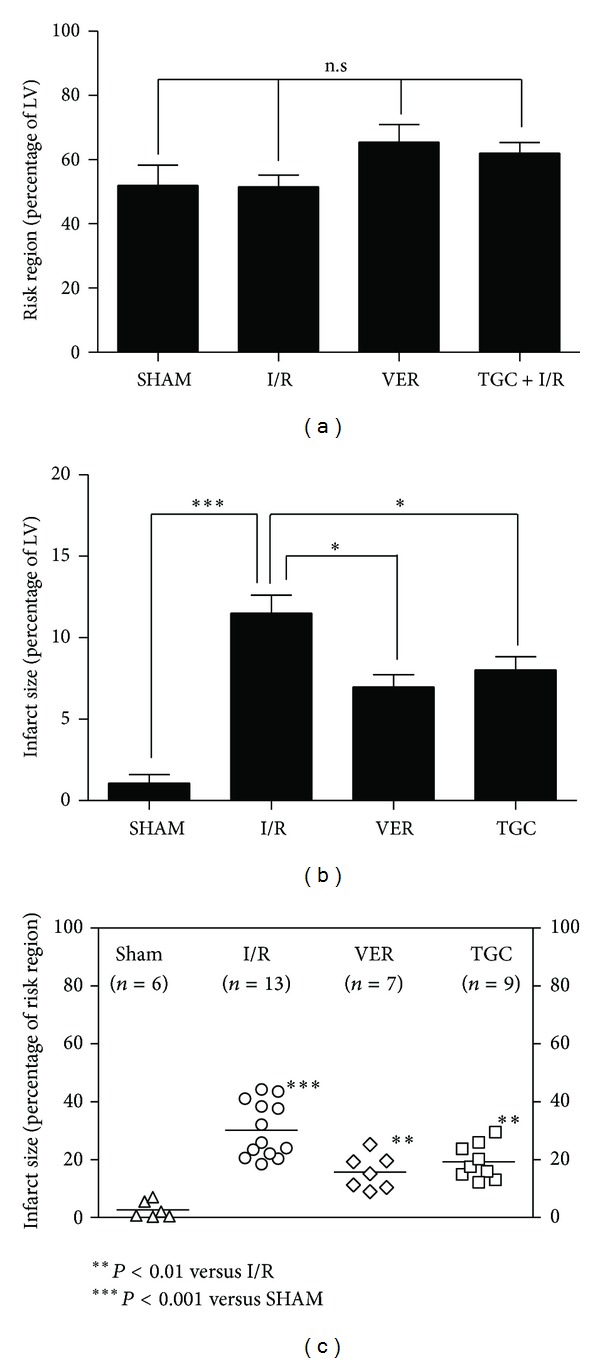
Figure 3.

The risk regions and infarct sizes. (a) Myocardial risk region (RR) expressed as percent of left ventricle. (b, c) myocardial infarct sizes (IS) expressed as percent of total LV (b) and ischemic reperfused area ((c), risk region, RR). Data are presented as mean ± SEM, ***P < 0.001 I/R group compared with SHAM, *P < 0.05, **P < 0.01 IS (percentage of LV and RR) in TGC and VER groups versus I/R group, respectively.
