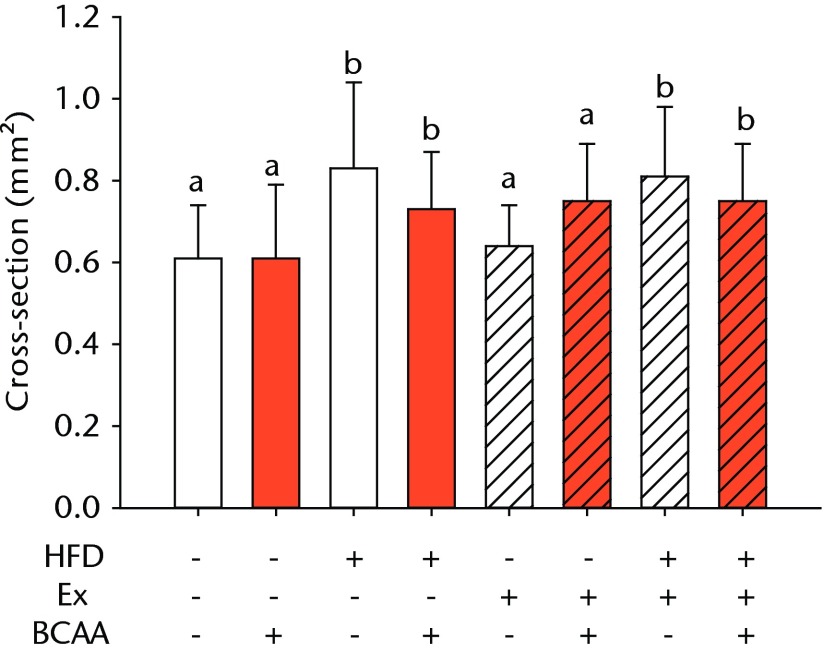
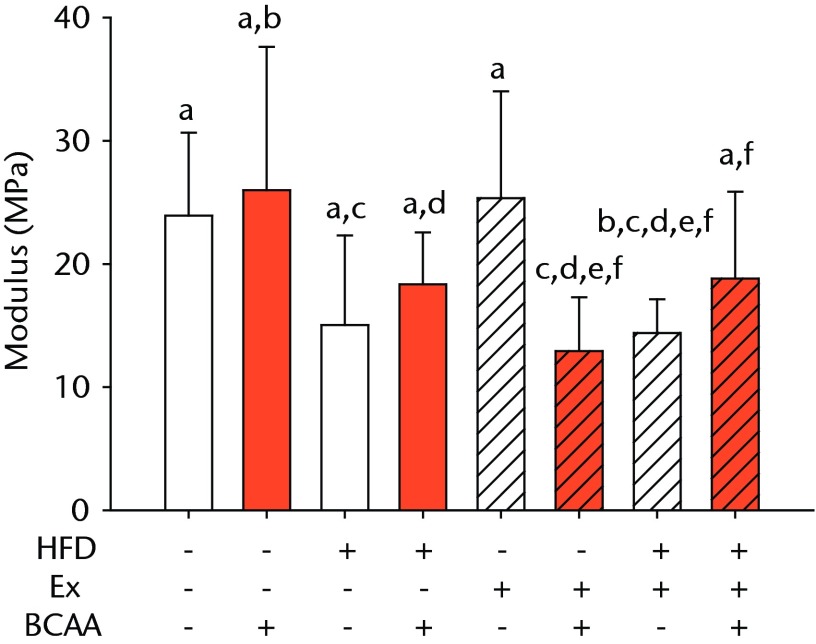
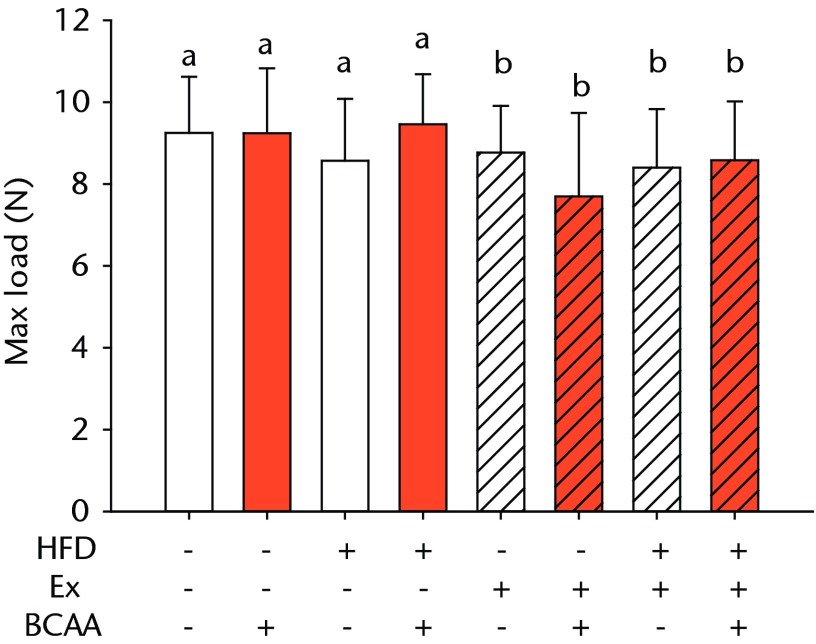
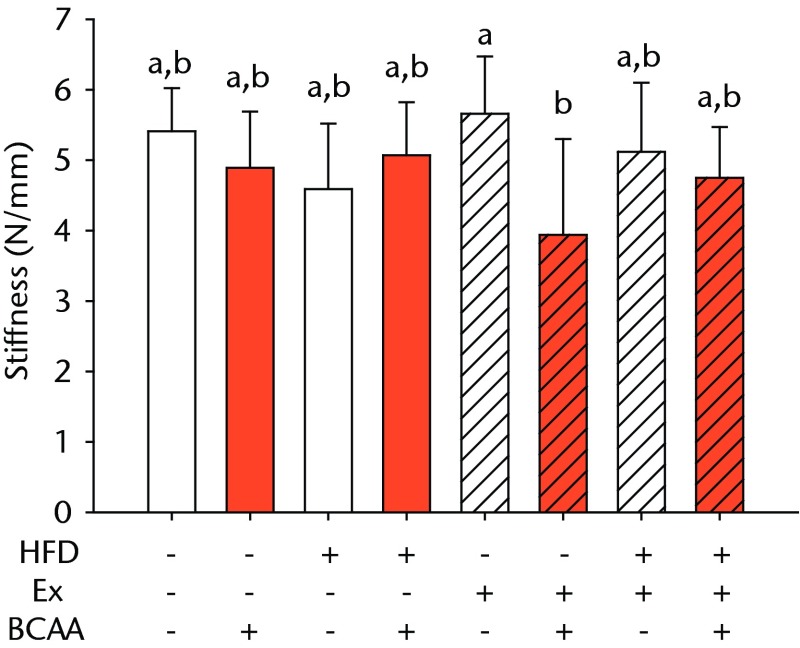
Figs. 2a - 2d.
Bar charts of biomechanical parameters, showing the mean a) tendon cross-section area, b) modulus, c) maximum load and d) stiffness. Biomechanical parameters with significant changes. For tendon cross-section (a), groups not sharing a letter (‘a’ or ‘b’) are significantly different, based on a significant main effect for high fat diet (HFD) and no other significant main effects or interactions. For modulus (b), groups not sharing a letter (‘a’, ‘b’, ‘c’, ‘d’, ‘e’, or ‘f’) are significantly different, based on post-hoc comparisons following a significant three-way interaction between HFD, exercise (Ex), and branched-chain amino acid (BCAA). For maximum load (c), groups not sharing a letter (‘a’ or ‘b’) are significantly different, based on a significant main effect for exercise and no other significant main effects or interactions. For stiffness (d), groups not sharing a letter (‘a’ or ‘b’) are significantly different, based on post-hoc comparisons following significant two-way interactions between HFD and BCAA as well as between exercise and BCAA. Error bars indicate standard deviation.


