
Figure 3.
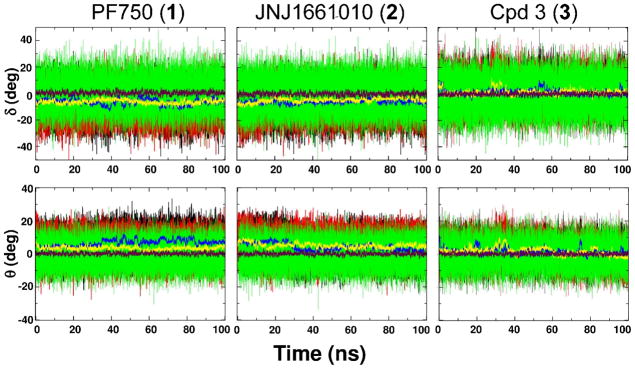
Dihedral angle δ (first row) and improper torsion θ (second row) value fluctuation during the 100 ns of MD simulation of 1 (first column), 2 (second column) and 3 (third column). Black and red thin lines are instantaneous values in Mnr A and Mnr B, respectively, while green thin lines are those in water. The running average values are calculated over 200 ps for δ and θ (blue and yellow thick lines for Mnr A and Mnr B, respectively). The maroon thick line represents the average value measured in water solution.