
Fig. 4.
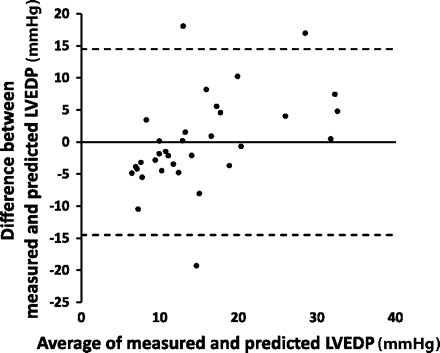
Bland-Altman plot. Predicted LVEDP was calculated from PAR based on the regression equation from measured LVEDP vs. PAR as plotted in Fig. 3.
Official websites use .gov
A
.gov website belongs to an official
government organization in the United States.
Secure .gov websites use HTTPS
A lock (
) or https:// means you've safely
connected to the .gov website. Share sensitive
information only on official, secure websites.
Bland-Altman plot. Predicted LVEDP was calculated from PAR based on the regression equation from measured LVEDP vs. PAR as plotted in Fig. 3.