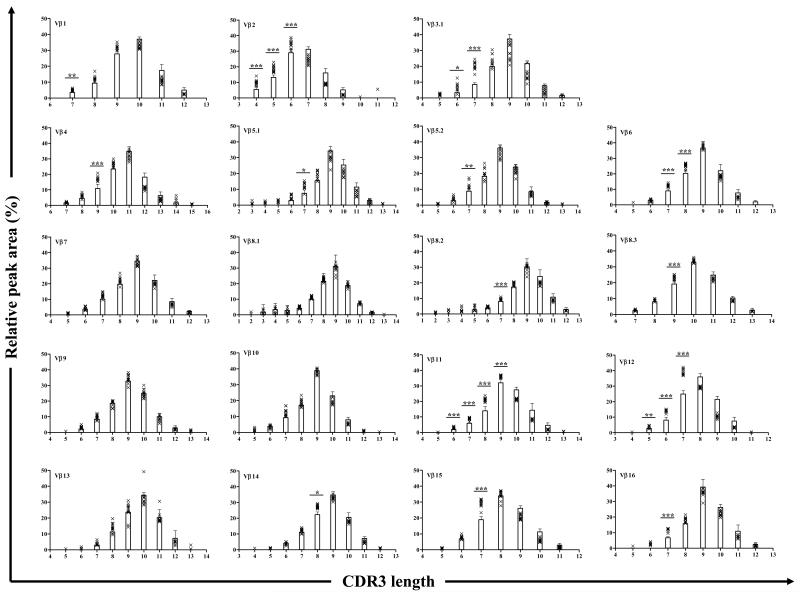
Figure 2. The majority of 4 week old NOD mice display the same altered TCR Vβ repertoire in pancreatic lymph nodes.
The Vβ CDR3 spectratype of 19 Vβ families was compared between thymus (n=5) and PLN (n=11) of 4 week old NOD mice. The bars represent the mean ± 3 SD of relative peak area for each CDR3 length in each Vβ family for thymus. The relative peak area for each CDR3 length in each Vβ family for PLN in individual mice is indicated by an x on the same plot. Peaks in PLN that are significantly different from the equivalent peak in thymus in at least 80% of mice tested are indicated with asterisk above the respective bar: ***, p<0.0001; **, p<0.001 or *, p<0.01 by ANOVA. The x-axis shows the CDR3 length in amino acid and the y-axis shows the relative peak area (%).

