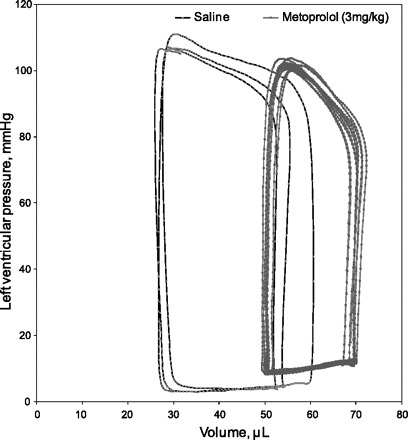
Fig. 2.

Representative pressure-volume loop before and after metoprolol administration in mice. An example of a tracing of steady state pressure-volume loops recorded in a representative mouse (n = 6). Steady-state loops were acquired 10 min after intravenous saline bolus and 10 min after intravenous metoprolol bolus. In this case, there is a clear increase in the end diastolic and systolic volumes and a reduction in stroke volume and ejection fraction after metoprolol administration.
