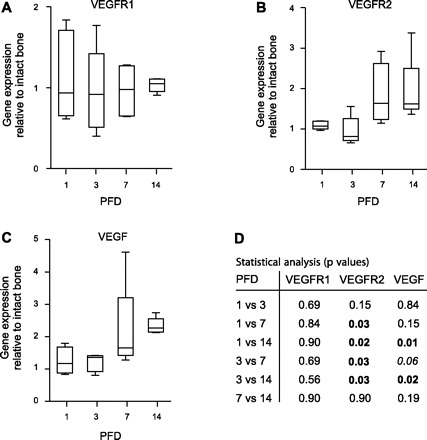
Fig. 2.

Analysis of vascular endothelial growth factor (VEGF) receptor 1 (VEGFR1), VEGFR2, and VEGF transcript expression. The time course of mRNA expression of VEGFR1 (A), VEGFR2 (B), and VEGF (C) was determined by quantitative RT-PCR, as detailed in materials and methods. Box plots with whiskers represent gene expression relative to intact bone (IB), with error bars indicating median, minimum, and maximum of all individual animals for each PFD. D: the table shows a detailed statistical analysis, presenting P values for PFD comparisons for each target of interest (numbers in bold denote statistical significance; number in italics indicates value that is close to a statistical significant difference).
