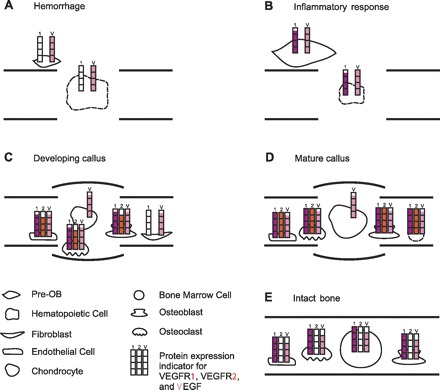
Fig. 4.

Morphological-molecular correlation model. The cartoon depicts the four healing phases (A–D) and the intact control bone (E), which were investigated in this study. For each healing phase (A: hemorrhage formation on PFD 1; B: inflammatory response on PFD 3; C: initiation of callus development on PFD 7; and D: the presence of a mature callus on PFD 14) and IB, the protein expression signature for VEGF, VEGFR1, and VEGFR2, as determined in this study (Fig. 3), was visualized semiquantitatively using color-coded protein expression indicators for VEGFR1 (red), VEGFR2 (orange), and VEGF (pink). Assignment of the protein expression indicators to the cell types present in a particular healing phase or IB was based on previous immunohistological studies that defined presentation of the components of the VEGF-VEGFR axis on bone-healing cells. These studies included investigations on endochondral (28, 42, 47, 49) and intramembranous (4, 35, 39, 58) bone healing. If the presence of a component of the VEGF-VEGFR axis has previously not been validated for a particular cell type, the corresponding bar of the protein expression indicator was excluded. Hematopoietic and bone marrow cells are marked with dashed lines to indicate that expression of the VEGF-VEGFR axis, specifically during bone healing, has yet to be confirmed. The hematopoietic cell composition during fracture healing is largely unknown. Involvement of neutrophils and macrophages, which express VEGF and VEGFR1, respectively (38, 51), has been suggested (1). Expression of the VEGFR-VEGFR axis on bone marrow cells has been reported (24), but protein assignments to bone marrow cells are limited due to cell heterogeneity. Cell types dominant at a healing phase are shown enlarged. This model allows for relative comparisons between the healing phases, but does not permit quantitative comparisons between VEGFR1, VEGFR2, and VEGF. Pre-OB, osteoblast precursor cell.
