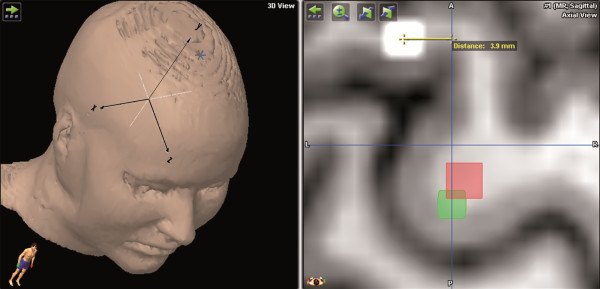
Figure 1.

This figure shows an example of the measurement for hotspot distances. The yellow line indicates the distance between the white and red spots and, therefore, shows the interobserver hotspot distance in mm (green spot = hotspot first mapping; white spot = hotspot second mapping/first remapping; red spot = hotspot third mapping/second remapping). The left upper quadrant shows the orientation of the used coordinate system.
