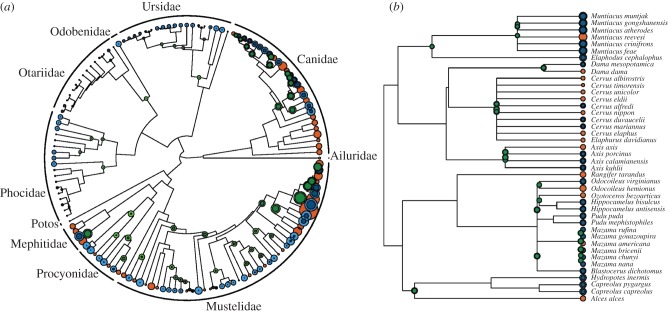
Figure 2.
Phylogenetic relationships within the (a) Caniformia and (b) Cervidae giving predicted node and tip reconstruction of  for the PIC-r models. The circles at each tip or node have diameter proportional to values of r ranging from −0.647 to 2.75 (a) and between 0.22 and 0.55 (b). Orange circles represent tips with observed r-values, green circles show reconstructed nodes from which tips were predicted and blue circles represent unknown, predicted tips. For green and blue, the darker inner and lighter outer circles show the estimated
  -value minus or plus the s.e., respectively.

