
Figure 1.
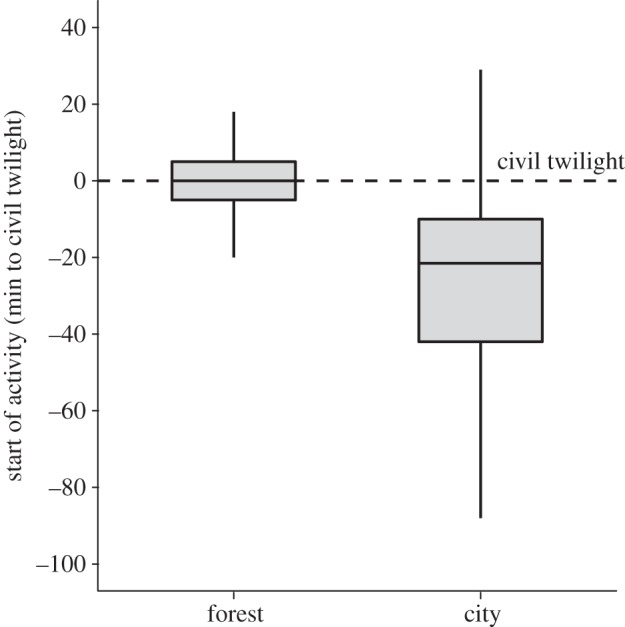
Differences in daily start of activity between forest and city European blackbirds in the wild. Daily activity was continuously recorded on free-living forest (n = 6) and city (n = 6) birds by an automated telemetry system. Start of activity was standardized to the onset of civil twilight (dashed horizontal line) to correct for daily changes in photoperiod. Values indicate minutes before (negative values) or after (positive values) the morning onset of civil twilight. Box plots represent, from bottom to top: one standard deviation (s.d.) below the mean, lower quartile, median, upper quartile and one s.d. above the mean.