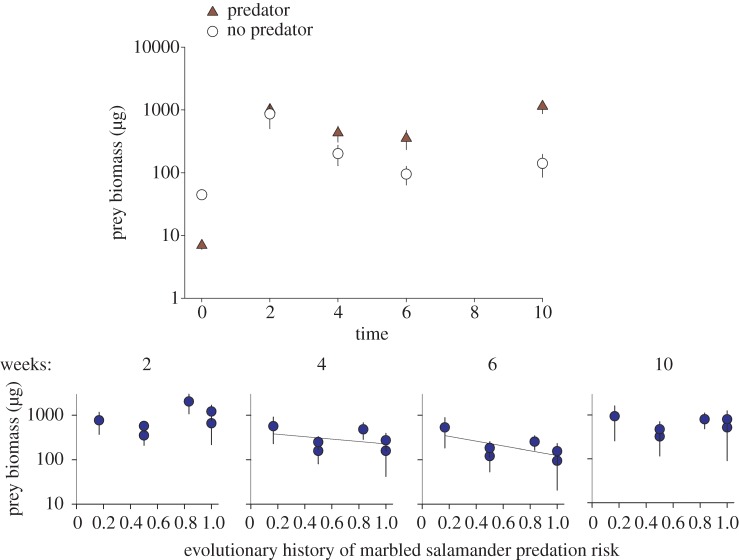
Figure 3.
Changes in prey invertebrate biomass through time with and without marbled salamander predation (a) and depending on spotted salamander evolutionary history of predation (b). Means of back-transformed fitted values from mixed-effect models are depicted ± s.e.m. The interaction between evolutionary history and time was significant in the full model. For presentation purposes, linear regression lines are plotted in the bottom graph for r2 values > 0.2. (Online version in colour.)

