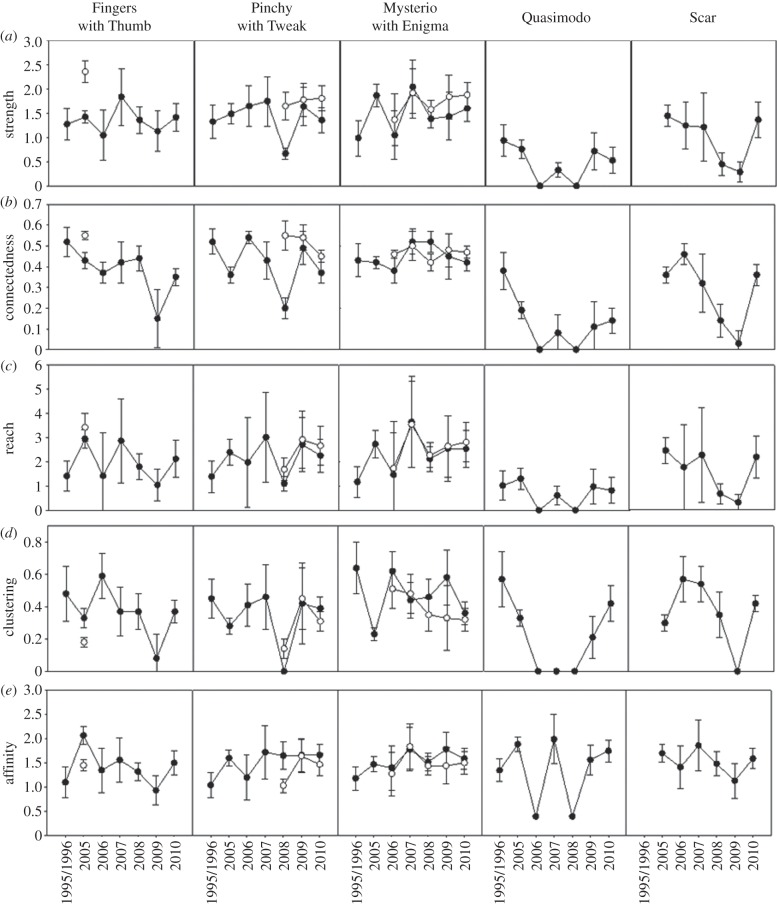
Figure 2.
(a–e) Plots of all network measures for each of the adults in the Group of Seven unit, excluding Puzzle Piece (#5130), who was only alive the first year of the study. 1995 and 1996 data from supplementary data of IFAW research [22]. Calves are shown on mothers' plots as white symbols. Error bars are standard errors based on 1000 bootstrap replicates.

