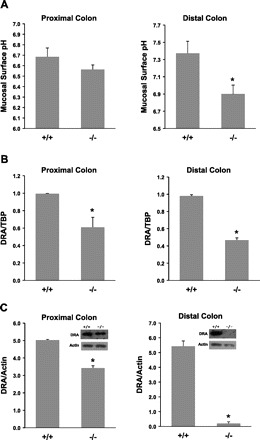
Fig. 7.

Mucosal surface pH measurement and downregulated in adenoma (DRA) expression. Colonic segment was freshly cut and opened, and mucosal surface pH was measured immediately using a flat surface pH probe. Data are means ± SE from a total of 8 mice (8–10 wk old males and females). *P ≤ 0.003 for NHE8−/− mice (−/−) vs. wild-type mice (+/+). RNA was isolated from colon and used for PCR analysis. DRA mRNA and TBP mRNA were amplified with mouse-specific primers. Changes in DRA gene expression were analyzed by the comparative cycle threshold (Ct) method. Data are means ± SE from a total of 10 mice (8- to 10-wk-old males and females). *P ≤ 0.04 for NHE8−/− mice (−/−) vs. wild-type mice (+/+). Total tissue lysate was prepared from colon and used for Western blot detection. Protein (30 μg) was loaded on SDS-PAGE gels and immunoblotted. DRA antibody and β-actin antibody were used to detect DRA and β-actin, respectively. Expression of DRA protein was calculated by dividing the optical density of the DRA band over that of the β-actin band. Bar chart shows the DRA protein expression indicated as means ± SE in the sum of a total of 12 mice (8- to 10-wk-old males and females). *P ≤ 0.01 for NHE8−/− mice (−/−) vs. wild-type mice (+/+). Inset: corresponding Western blot image.
