
Fig. 8.
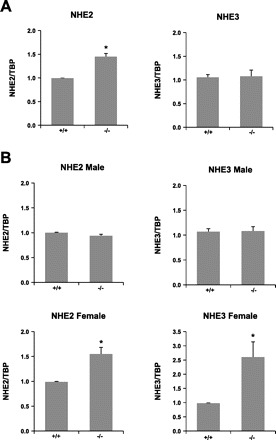
NHE2 and NHE3 expression in NHE8−/− mice. RNA was isolated from the intestine and used for PCR analysis. NHE2 and NHE3 mRNA and TBP mRNA were amplified with mouse-specific primers. Changes in NHE2 and NHE3 gene expression were analyzed by the comparative cycle threshold (Ct) method. Data are means ± SE from a total of 12 mice. *P ≤ 0.01 for NHE8−/− mice (−/−) vs. wild-type mice (+/+). A: NHE2 and NHE3 gene expression in 2-wk-old mice. B: NHE2 and NHE3 gene expression in 8-wk-old mice.