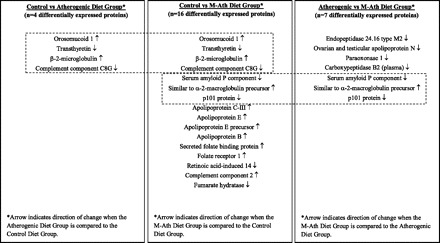
Fig. 1.

List of 20 differentially expressed priority 1 proteins and the similarities and differences among diet groups. Comparison of all priority 1 proteins with a significant change (q < 0.05) revealed 4 common proteins with differential expression when comparing both the control and atherogenic diet groups and the control and modified atherogenic (M-ath) diet groups (compare left and middle columns). Expression of 3 proteins changed significantly (q < 0.05) when comparing both the control and M-ath diet groups and the atherogenic and M-ath diet groups (compare middle and right columns). Additional proteins that changed significantly when comparing groups are also listed.
