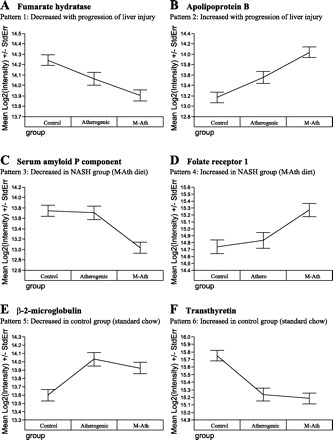
Fig. 2.

Representative proteins with significant differential expression between diet groups. Six general patterns for changes in protein expression among diet groups were noted, and a representative protein from each group is displayed (A–F). The mean log2 intensity ± SE (y-axis) is shown for each of these proteins (a difference of one unit is equivalent to a twofold change). NASH, nonalcoholic steatohepatitis; StdErr, standard error.
