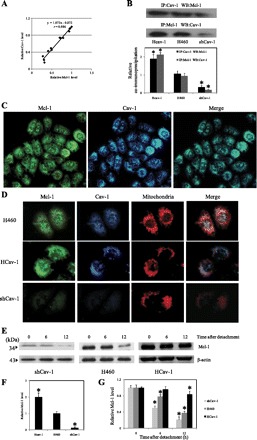
Fig. 3.

Interaction and localization of Cav-1 and Mcl-1. A: correlation analysis of the expression of Cav-1 and Mcl-1 after detachment of H460 cells. B: immunoprecipitation (IP) experiments were performed using specific anti-Cav-1 antibody; immunoblots were probed with anti-Mcl-1 antibody and vice versa. Equal amounts of protein (25 μg) were loaded in each lane. WB, Western blotting. Columns are means ± SD (n = 3). *P < 0.05 vs. control transfected cells. C: H460 cells were analyzed for localization of Cav-1 and Mcl-1 by immunofluorescence microscopy. Immunofluorescence was performed using mouse anti-Cav-1 monoclonal antibody and rabbit anti-Mcl-1 polyclonal antibody, followed by appropriate secondary antibodies labeled with Alexa Fluor 350 and Alexa Fluor 488 to visualize Cav-1 and Mcl-1, respectively. Cells were also stained with MitoTracker Red CMXRos (300 nM) to aid visualization of mitochondria. D: differential expression of Cav-1 and Mcl-1 in HCav-1, shCav-1, and H460 cells. Cells were fixed and processed for immunofluorescence staining. E: dependence of Mcl-1 reduction after cell detachment on Cav-1 expression. HCav-1, shCav-1, and H460 cells were detached and suspended in poly-HEMA-coated plates for various times (0–12 h). Blots were probed with specific antibody to Mcl-1 and were reprobed with β-actin antibody to confirm equal loading of samples. F: relative Mcl-1 levels in attached cells. G: relative Mcl-1 levels in shCav-1, HCav-1, and H460 cells after detachment for 0, 6, and 12 h. Columns are means ± SD (n = 3). *P < 0.05 vs. control at detachment time = 0 h.
