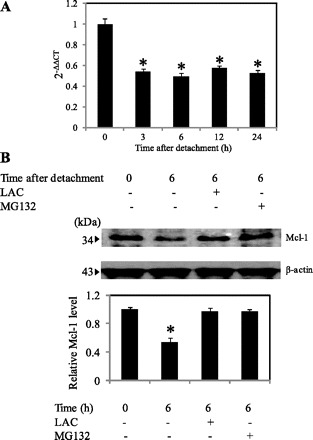
Fig. 4.

Transcription and degradation of Mcl-1 after cell detachment. A: real-time PCR analysis of Mcl-1 mRNA expression after cell detachment. The relative mRNA expression was determined by using the comparative CT method as described in materials and methods. Columns are means ± SD (n = 3). *P < 0.05 vs. control at detachment time = 0 h. B: relative Mcl-1 expression after detachment for 0–6 h in the presence or absence of lactacystin (LAC; 20 μM) or MG132 (10 μM) in H460 cells. Columns are means ± SD (n = 3). *P < 0.05 vs. control at detachment time = 0 h.
