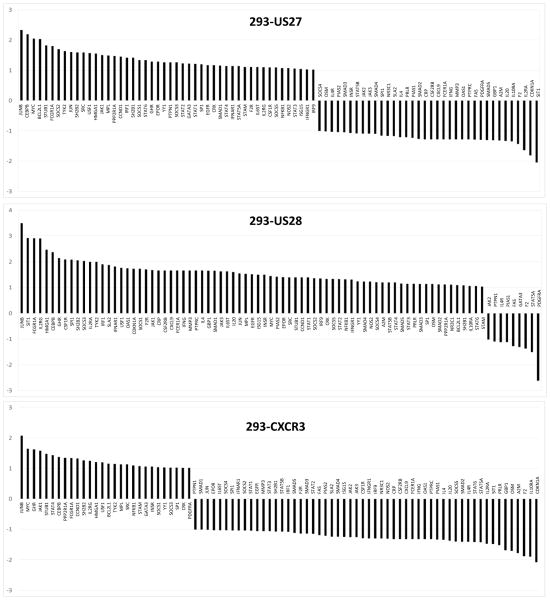
Figure 3. JAK-STAT pathway gene expression levels in cells expressing US27, US28, or CXCR3.
RNA from stable cell line was extracted using RNEasy Midi Kit (Qiagen, Valencia, CA), cDNA was prepared using the RT2 First Strand Kit (Qiagen), and then diluted cDNA was mixed with the RT2 SYBR green master mix (Qiagen) according to the manufacturer’s instructions and loaded into the Human Jak-Stat RT2-PCR Profiler Array (SABiosciences, Valencia, CA). Real Time PCR was performed using the CFX96 (BioRad, Hercules, CA) by heating to 95°C for 10 minutes followed by 40 cycles of 95°C for 15 seconds and 60°C for 1 minute. Data was analyzed using the ΔΔCt method according to the SABiosciences web portal (www.SABiosciences.com/pcrarray.dataanalysis.php) and further recalculated manually. The same threshold value was used across all plates in the same data analysis to ensure accurate reading of quality controls. The data were normalized across all plates to the following housekeeping genes: beta-2-microglobulin (B2M), hypoxanthine phosphoribosyltransferase 1 (HPRT1), ribosomal protein L13a (RPL13A), glyceraldehyde-3-phosphate dehydrogenase (GAPDH), and beta actin (ACTB). Controls for genomic DNA contamination RNA quality, and PCR performance were all in the recommended ranges. Data are represented as fold change compared to expression levels in HEK293 cells. The results are the average of three biological replicates.

