
Fig. 2.
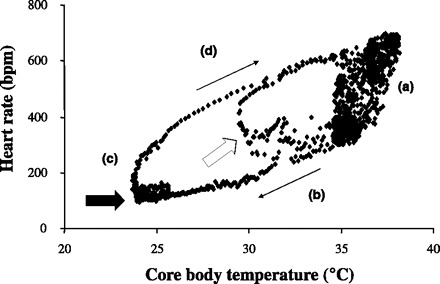
Heart rate/core Tb relationship during torpor in the mouse. The data from the mouse shown in Fig. 1 are shown here. When heart rate is plotted as a function of core Tb, a complex relationship is observed with four different regions, labeled (a), (b), (c), and (d). Please see text for discussion of heart rate control in each of these regions. The white and black arrows correspond to the same arrows in B of Fig. 1. The thin arrows show the progression of the torpor bout in time.