
Fig. 4.
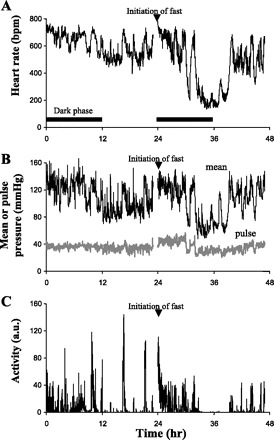
Heart rate, mean arterial pressure, pulse pressure, and activity of a fasted mouse over a 23-h period. These typical tracings were obtained over 48 h from a C57BL/6J mouse implanted with a blood pressure telemeter. A: dark phases are shown. The mouse was fasted at the beginning of the dark phase on the second day. Ta was 19°C over both days. These tracings show a similar pattern of heart rate (A) and activity (C) as seen in Fig. 1. Mean arterial blood pressure (B) declines with both heart rate and inactivity. Minimum heart rate and minimum mean arterial pressure in this mouse was 135 bpm and 48 mmHg, respectively.