Figure 3.
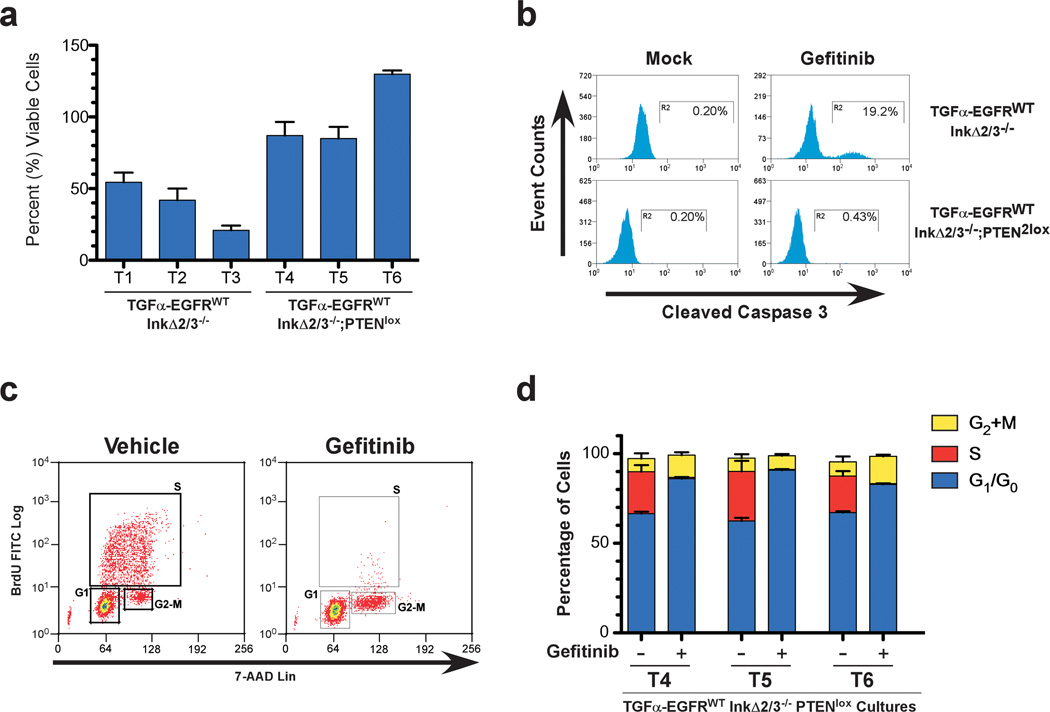
Cytostaticity of EGFR kinase inhibition in TGFα-EGFRWT GBM tumor cells. (a) TGFα-EGFRWT;InkΔ2/3−/− tumor cells are sensitive to gefitinib treatment whereas TGFα-EGFRWT;InkΔ2/3−/−;PTENlox cells are resistant. Viability assays of three independent tumor cell cultures from the indicated genotypes after vehicle or gefitinib treatment (10 µM) for 24 hours. Data is plotted as percentage of viable cells of treated over vehicle treatment (mean ± SD; n=3 in each group). (b) Representative flow-cytometric analysis of vehicle- and gefitinib-treated TGFα-EGFRWT;InkΔ2/3−/− and TGFα-EGFRWT;InkΔ2/3−/−;PTENlox GBM tumor cells indicating an increase in cleaved caspase-3 positive cells upon EGFR kinase inhibitor treatment. (c) Primary tumor cultures from TGFα-EGFRWT;InkΔ2/3−/−;PTENlox GBMs were incubated overnight in low serum (0.1% FBS) media then challenged with 10 µM of gefitinib for 24 hours. BrdU incorporation and 7-AAD levels were measured by flow cytometry to determine cell cycle profiles for treated and untreated cultures. Representative plots for BrdU incorporation vs. 7-AAD levels for determination of cell cycle profiles in vehicle and gefitinib-treated cells are shown. (d) Graphical representation of the distribution (percentage) of cells in G2+M, S, or G1/G0 for TGFα-EGFRWT;InkΔ2/3−/−;PTENlox GBM cultures T4, T5, and T6. The small percentage of cells in sub-G1 is not included in this graph. (mean ± SD; n=3 in each group).

