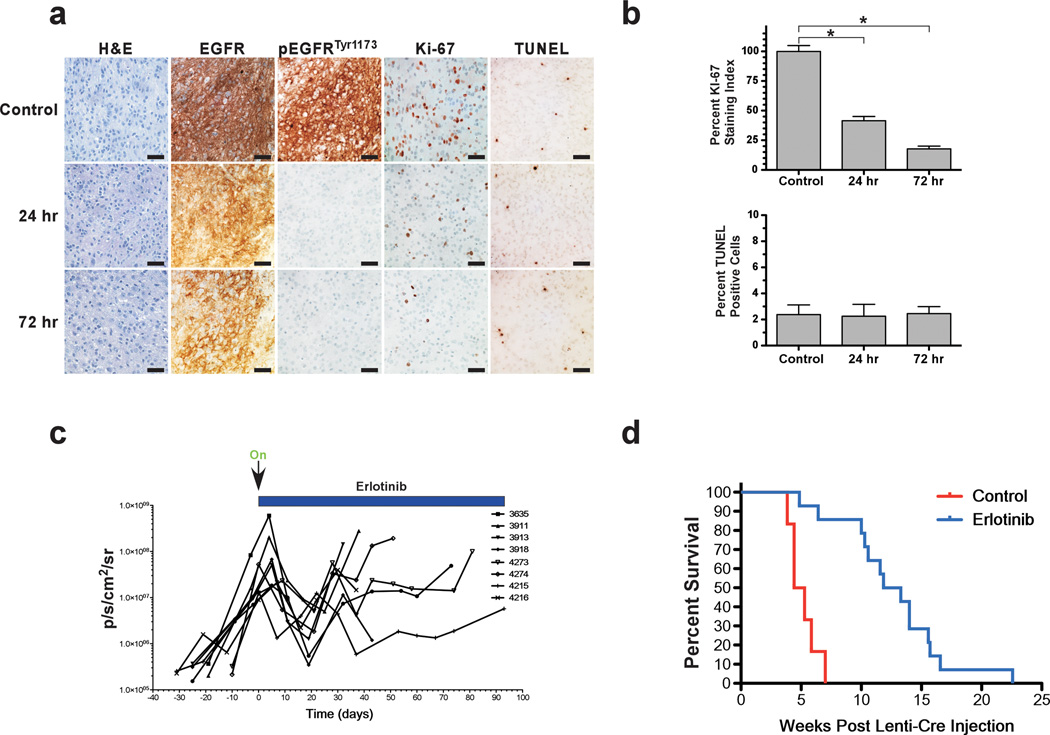
Figure 4.
Inhibition of EGFR prolongs survival in mice. (a) Treatment of TGFα-EGFRWT;InkΔ2/3−/−;PTENlox mice with the EGFR TKI erlotinib inhibits EGFR activity. Mice were treated with erlotinib formulated in Ora-Plus (Paddock Lab) and administered by oral gavage daily Monday to Friday at 150mg/kg dose and sacrificed at the indicated times and processed for histology. IHC of representative GBM tumors for total human EGFR expression, activated EGFR (pTyr1173), the proliferation marker Ki-67 and for apoptosis by TUNEL are shown. (b) Graphical representation of the quantification of proliferation assayed by Ki-67 staining and for the percentage of apoptotic cells as measured by the number of TUNEL positive cells. The Ki-67 staining data is presented as percentage of Ki-67 positive cells in treated tumors over control tumors (*p<0.001, two-tailed t-test) and quantification of apoptosis is presented as percentage of TUNEL positive cells per field of view. (c) Bioluminescence imaging monitoring of treatment course. EGFRWT;InkΔ2/3−/−;PTEN2lox mice were injected with pTyf-TGFα-IRES-iCre lentivirus and 14 days later were imaged for presence of tumor. Once tumors were detected, animals were imaged once a week. Initiation of treatment with erlotinib commenced once BLI values surpassed 1.0 × 10⁷ photons/sec/cm2/sr. Animals were treated with erlotinib on a schedule of five days on 2 days off and monitored for response using BLI (d) Animals remained on this treatment until moribund to establish overall survival. Kaplan-Meier survival curves of control (red, n=6) and erlotinib-treated (blue, n=14) tumor bearing animals. The difference in survival is significant, p<0.0001, Log-rank (Mantel-Cox) test.

