
Fig. 1.
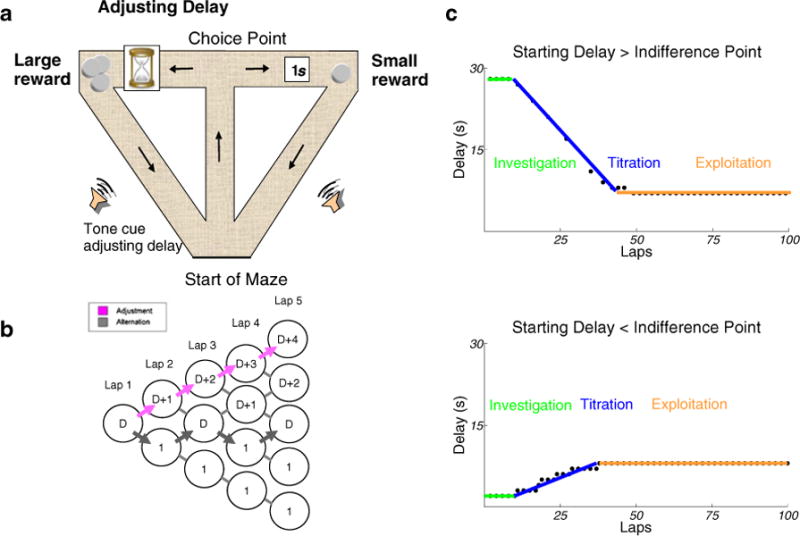
Task diagram and predicted results a The spatial delay-discounting task. A lap (arrows) comprised a journey from the start of the maze to a choice point at the T-junction, to reward receipt at either the left feeder or the right feeder, and then back to the start of the maze. The delay before delivery of the larger of these two rewards varied on the basis of the choices of the rat. Sampling the larger reward caused the delay to increase; sampling the smaller reward caused it to decrease; thus, alternation maintained the same delay. An audible tone cue sequence accompanied the delay to food delivery. b Tree diagram illustrating changes in the adjusting delay as a function of lap. For a starting delay D on lap 1, the diagram illustrates two possible delay sequences for lap 2 through lap 5: (1) an upward titration composed of four adjustment laps to the large reward (magenta arrows) and (2) a sequence composed of four alternation laps from large-to-small reward and back (gray arrows). In the upward titration example, the large reward is sampled repeatedly, and the delay before reward delivery increases by 1 on each lap. In the alternation example, the large reward is sampled on odd laps, and the delay preceding the large reward is fixed at D seconds on each lap. c Sample sessions illustrating predicted behavior. First, information is acquired about the specific task parameters of the day (investigation, green), then the delay is adjusted to a preferred value (titration, blue), and lastly, this preference is maintained through alternation, maintaining the delay at the indifference point (exploitation, orange)