
Fig. 2.
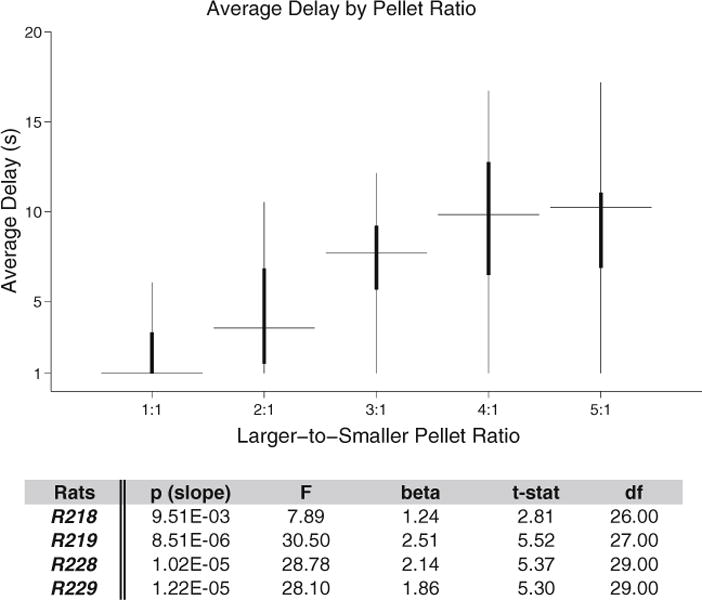
Rats titrate to different delays as a function of different reward ratios. In Experiment 1, the indifference point was a function of the magnitude of the larger reward. Four rats ran 115 sessions with pseudorandomly selected larger rewards of R pellets (where R = 1, 2, 3, 4, 5, and R:1 indicates the larger-to-smaller reward ratio) and starting delays selected from a subset of 1 s to 30 s intervals. A boxplot of the indifference point versus the larger-to-smaller reward ratio is displayed where the horizontal line is the group median, the shaded box covers the 25th–75th per-centile, and the whiskers are the 99th percentile of the data for each group. This relationship was well-described by a linear equation