
Fig. 4.
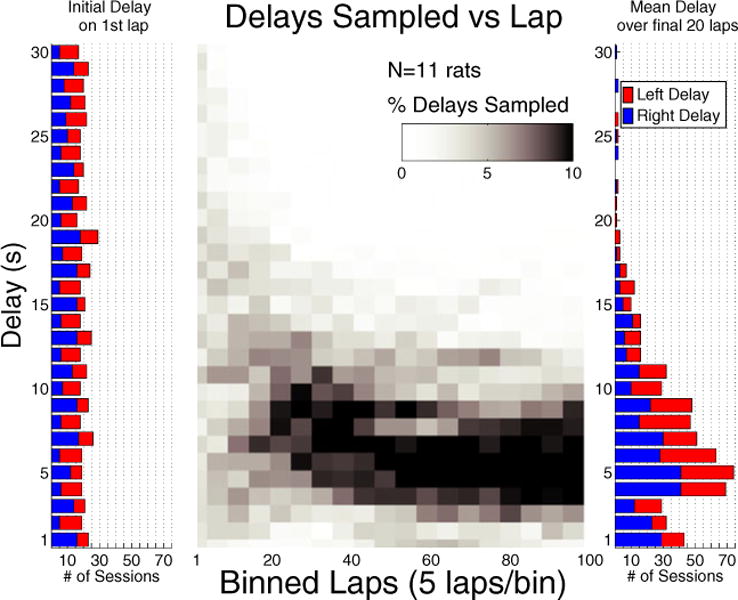
Rats choose a consistent range of adjusting delays. For the 3:1 reward ratio in Experiment 2, rats (N = 11) titrated an adjusting delay to a consistent indifference point across all sessions (N = 613). A histogram of the initial delays (left panel) for right-side delay (red) and leftside delay (blue) shows a uniform distribution of initial delays. The probability of choosing a given delay on a given lap is displayed in white-to-black shading, with darker shading indicating a higher probability (center panel). The proportion of delays chosen in the 3 s to 9 s range increased with lap. A histogram of the indifference point for all sessions (right panel) shows that the initial delays were transformed into a consistent distribution in this lower third of the delay range