
Fig. 5.
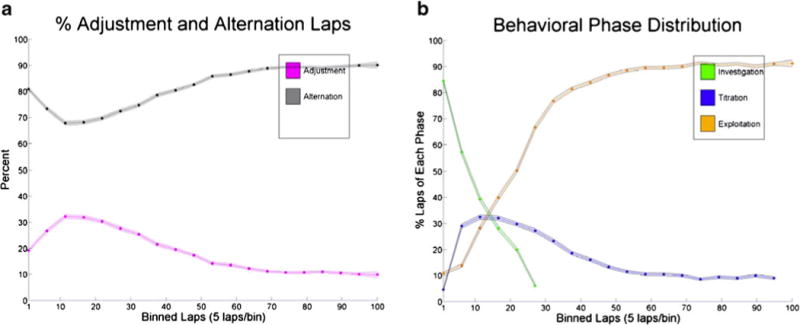
Categorizing three phases of behavior. a The distribution of adjustment and alternation laps. Adjustment laps (magenta) were defined as consecutive laps to the same side, while alternation laps (gray) were defined as laps to opposite sides. The mean (shaded circles) and standard error (shading) are displayed. The distribution of adjustment laps peaks around laps 10–20, with alternation laps dominating both before and after this peak. This profile suggests three dissociable phases of behavior on the task. b Individual sessions were divided into three phases of behavior using a five-lap sliding window. The mean percentage of laps falling into the definition of each behavioral phase is plotted by lap number (shaded circles) with the standard error (shading). The profiles of the behavioral phases followed the distribution of adjustment and alternation laps. The phases were labeled investigation, titration, and exploitation according to the predictions made on the basis of the ideal decision-making agent